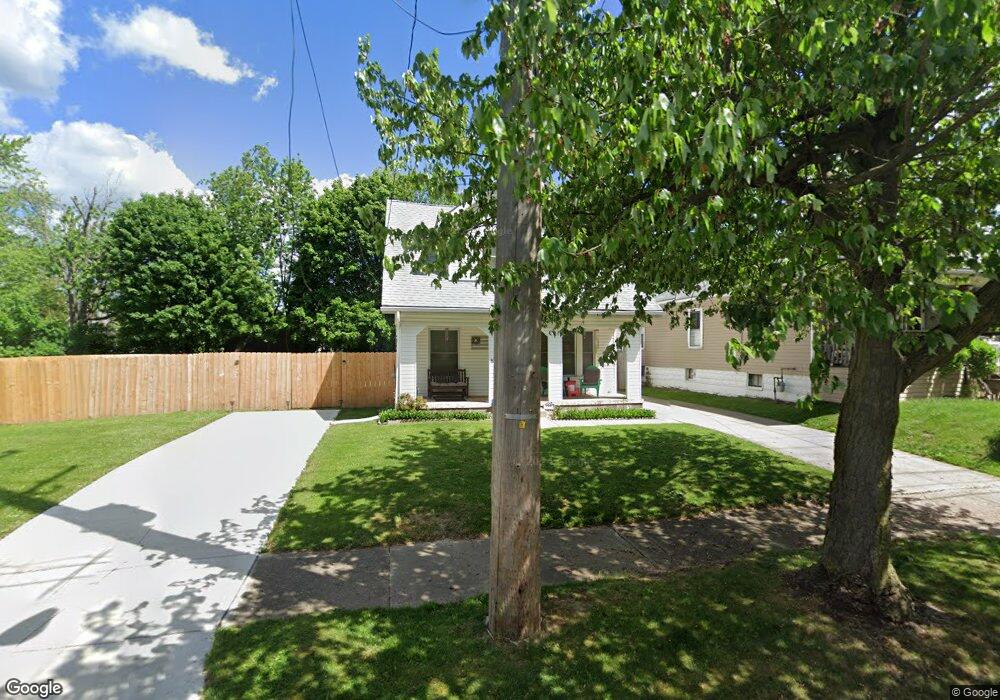
595 Morgan Ave Akron, OH 44311
South Akron NeighborhoodEstimated Value: $83,000 - $105,000
3
Beds
1
Bath
1,376
Sq Ft
$67/Sq Ft
Est. Value
About This Home
This home is located at 595 Morgan Ave, Akron, OH 44311 and is currently estimated at $92,131, approximately $66 per square foot. 595 Morgan Ave is a home located in Summit County with nearby schools including Glover Community Learning Center, Kenmore Garfield Community Learning Center, and Main Preparatory Academy.
Ownership History
Date
Name
Owned For
Owner Type
Purchase Details
Closed on
Dec 2, 2015
Sold by
City Of Akron
Bought by
Davis Mark and Davis Joelle M
Current Estimated Value
Purchase Details
Closed on
Nov 25, 2015
Sold by
Davis Mark and Davis Joelle M
Bought by
Davis Mark and Davis Joelle M
Purchase Details
Closed on
Sep 21, 2001
Sold by
Petersen Joelle M
Bought by
Davis Mark and Davis Joelle M
Create a Home Valuation Report for This Property
The Home Valuation Report is an in-depth analysis detailing your home's value as well as a comparison with similar homes in the area
Home Values in the Area
Average Home Value in this Area
Purchase History
| Date | Buyer | Sale Price | Title Company |
|---|---|---|---|
| Davis Mark | $256 | Minnesota Title Box | |
| Davis Mark | -- | Minnesota Title Box | |
| Davis Mark | -- | -- |
Source: Public Records
Mortgage History
| Date | Status | Borrower | Loan Amount |
|---|---|---|---|
| Closed | Davis Mark | $0 |
Source: Public Records
Tax History Compared to Growth
Tax History
| Year | Tax Paid | Tax Assessment Tax Assessment Total Assessment is a certain percentage of the fair market value that is determined by local assessors to be the total taxable value of land and additions on the property. | Land | Improvement |
|---|---|---|---|---|
| 2025 | $1,071 | $17,987 | $5,362 | $12,625 |
| 2024 | $1,071 | $17,987 | $5,362 | $12,625 |
| 2023 | $1,071 | $17,987 | $5,362 | $12,625 |
| 2022 | $868 | $11,012 | $3,154 | $7,858 |
| 2021 | $869 | $11,012 | $3,154 | $7,858 |
| 2020 | $857 | $11,010 | $3,150 | $7,860 |
| 2019 | $1,530 | $19,530 | $6,120 | $13,410 |
| 2018 | $1,510 | $19,530 | $6,120 | $13,410 |
| 2017 | $1,605 | $19,530 | $6,120 | $13,410 |
| 2016 | $1,702 | $21,840 | $8,120 | $13,720 |
| 2015 | -- | $21,840 | $8,120 | $13,720 |
Source: Public Records
Map
Nearby Homes