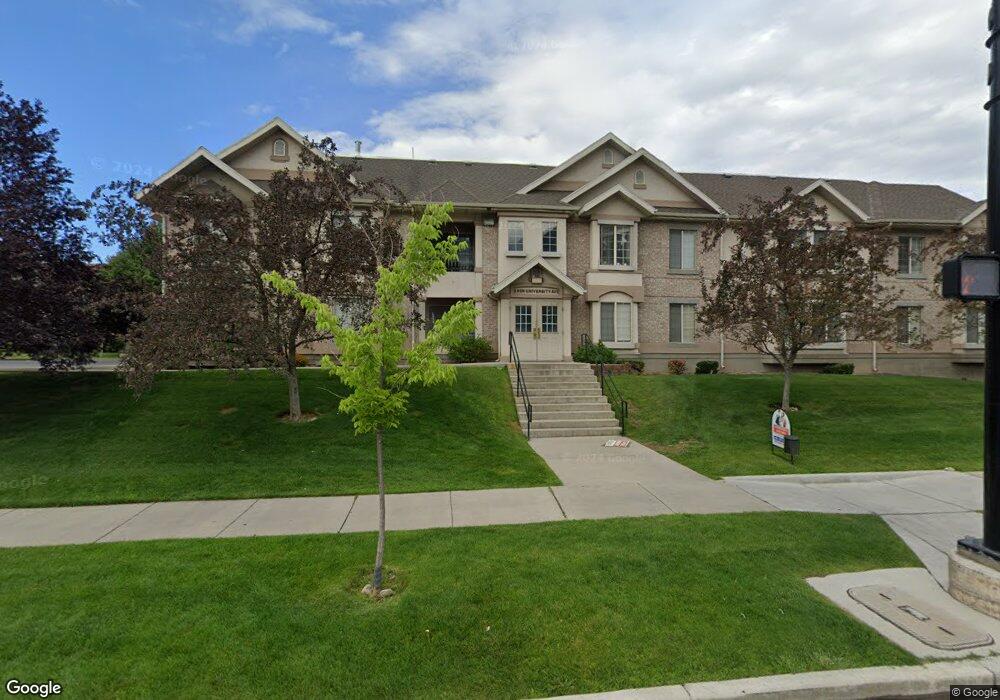
595 N University Ave Provo, UT 84601
Rivergrove NeighborhoodEstimated Value: $445,028 - $467,000
4
Beds
2
Baths
1,096
Sq Ft
$416/Sq Ft
Est. Value
About This Home
This home is located at 595 N University Ave, Provo, UT 84601 and is currently estimated at $456,257, approximately $416 per square foot. 595 N University Ave is a home located in Utah County with nearby schools including Provo Peaks School, Centennial Middle School, and Timpview High School.
Ownership History
Date
Name
Owned For
Owner Type
Purchase Details
Closed on
Aug 31, 2010
Sold by
Chealey Clinton H
Bought by
Kirkpatrick David Steven
Current Estimated Value
Home Financials for this Owner
Home Financials are based on the most recent Mortgage that was taken out on this home.
Original Mortgage
$127,500
Outstanding Balance
$84,491
Interest Rate
4.51%
Mortgage Type
Seller Take Back
Estimated Equity
$371,766
Purchase Details
Closed on
Feb 15, 2008
Sold by
D S University Avenue Properties Llc
Bought by
Chealey Clinton H
Purchase Details
Closed on
Aug 23, 2005
Sold by
D S University Properties Llc
Bought by
Ingram G Dean
Home Financials for this Owner
Home Financials are based on the most recent Mortgage that was taken out on this home.
Original Mortgage
$157,500
Interest Rate
5.61%
Mortgage Type
Fannie Mae Freddie Mac
Create a Home Valuation Report for This Property
The Home Valuation Report is an in-depth analysis detailing your home's value as well as a comparison with similar homes in the area
Home Values in the Area
Average Home Value in this Area
Purchase History
| Date | Buyer | Sale Price | Title Company |
|---|---|---|---|
| Kirkpatrick David Steven | -- | Cornerstone Title Insurance | |
| Chealey Clinton H | -- | Utah First Title Insurance | |
| Ingram G Dean | -- | Utah First Title Insurance | |
| D S University Properties Llc | -- | Utah First Title Insurance |
Source: Public Records
Mortgage History
| Date | Status | Borrower | Loan Amount |
|---|---|---|---|
| Open | Kirkpatrick David Steven | $127,500 | |
| Previous Owner | Ingram G Dean | $157,500 |
Source: Public Records
Tax History Compared to Growth
Tax History
| Year | Tax Paid | Tax Assessment Tax Assessment Total Assessment is a certain percentage of the fair market value that is determined by local assessors to be the total taxable value of land and additions on the property. | Land | Improvement |
|---|---|---|---|---|
| 2025 | $2,212 | $237,985 | $48,100 | $384,600 |
| 2024 | $2,212 | $217,690 | $0 | $0 |
| 2023 | $2,287 | $221,925 | $0 | $0 |
| 2022 | $1,933 | $189,145 | $0 | $0 |
| 2021 | $1,625 | $277,300 | $33,300 | $244,000 |
| 2020 | $1,603 | $256,400 | $30,800 | $225,600 |
| 2019 | $1,394 | $232,000 | $30,000 | $202,000 |
| 2018 | $1,375 | $232,000 | $30,000 | $202,000 |
| 2017 | $1,329 | $123,200 | $0 | $0 |
| 2016 | $1,426 | $123,200 | $0 | $0 |
| 2015 | $1,368 | $121,000 | $0 | $0 |
| 2014 | $1,256 | $114,400 | $0 | $0 |
Source: Public Records
Map
Nearby Homes
- 836 N University Ave Unit 111
- 136 E 400 N Unit 107
- 466 N 200 E
- 250 N 100 W Unit 109
- 75 E 200 N Unit 106
- 361 N 300 W Unit 201
- 394 N 300 E
- 270 N 400 W
- 209 N 400 W
- 556 W 800 N Unit 18
- 541 E 500 N Unit 10
- 541 E 500 N Unit 12
- 595 N 600 W
- 810 N 600 W
- 828 N 600 W
- 614 W 400 N
- 615 E 420 N
- 40 S Freedom Blvd
- 561 N 700 E
- 611 N 700 E Unit 5
- 595 N University Ave
- 595 N University Ave
- 595 N University Ave
- 595 N University Ave Unit 219
- 595 N University Ave
- 595 N University Ave
- 595 N University Ave
- 595 N University Ave
- 595 N University Ave
- 595 N University Ave Unit 119
- 595 N University Ave
- 595 N University Ave Unit 120
- 595 N University Ave Unit 221
- 595 N University Ave Unit 220
- 595 N University Ave Unit 122
- 595 N University Ave Unit 123
- 595 N University Ave Unit 223
- 595 N University Ave Unit 124
- 595 N University Ave Unit 224
- 595 N University Ave Unit 121