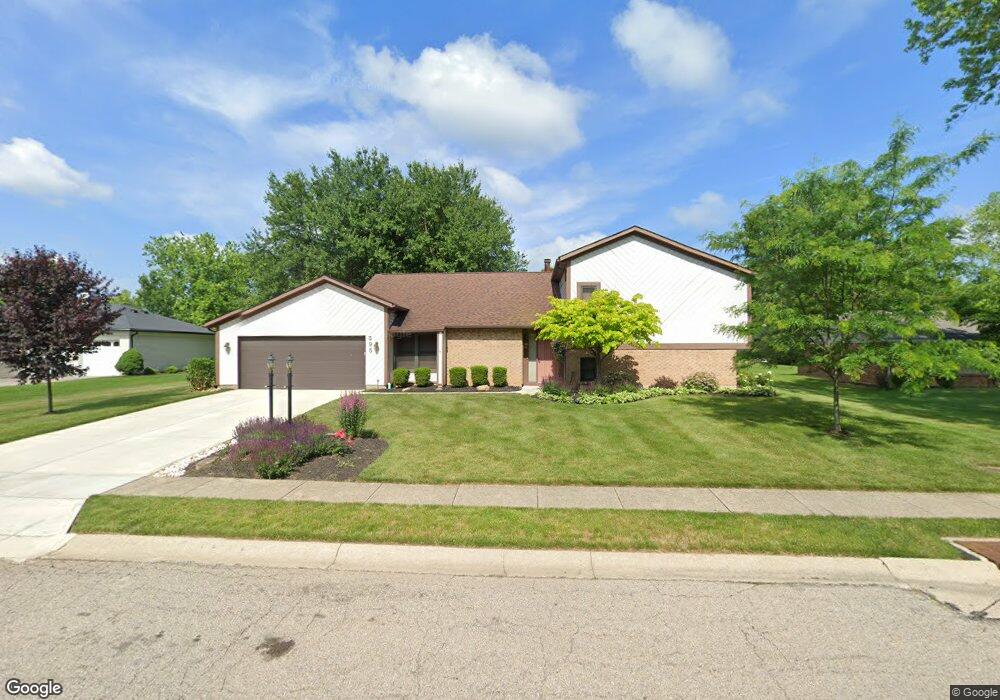
595 Queensgate Rd Springboro, OH 45066
Estimated Value: $363,084 - $404,000
3
Beds
2
Baths
2,090
Sq Ft
$182/Sq Ft
Est. Value
About This Home
This home is located at 595 Queensgate Rd, Springboro, OH 45066 and is currently estimated at $379,521, approximately $181 per square foot. 595 Queensgate Rd is a home located in Warren County with nearby schools including Clearcreek Elementary School, Springboro Intermediate School, and Dennis Elementary School.
Ownership History
Date
Name
Owned For
Owner Type
Purchase Details
Closed on
Jan 15, 2007
Sold by
Thomson Marilynn A
Bought by
Thomson Marilynn A and Marilynn A Thomson Living Trust
Current Estimated Value
Purchase Details
Closed on
Mar 13, 1995
Sold by
Ervin Walter C
Bought by
Thomson Lewis W and Moore Marilynn A
Purchase Details
Closed on
May 14, 1990
Sold by
Miller Scott and Miller Elizabeth
Bought by
Ervin and Ervin Walter C
Purchase Details
Closed on
Nov 26, 1986
Sold by
Caudill Caudill and Caudill David V
Bought by
Miller Miller and Miller Scott
Purchase Details
Closed on
Feb 12, 1986
Sold by
Litwiako Richard A and Litwiako Ca
Bought by
Caudill and Caudill David
Purchase Details
Closed on
Mar 8, 1983
Sold by
Graham Graham and Graham Jeffrey A
Bought by
Litwiako Litwiako and Litwiako Richard A
Purchase Details
Closed on
May 5, 1981
Sold by
Angel Enterprises & Inc
Purchase Details
Closed on
Dec 6, 1978
Sold by
Lsm Corporation
Purchase Details
Closed on
Jul 25, 1978
Sold by
Lsm Corp
Create a Home Valuation Report for This Property
The Home Valuation Report is an in-depth analysis detailing your home's value as well as a comparison with similar homes in the area
Home Values in the Area
Average Home Value in this Area
Purchase History
| Date | Buyer | Sale Price | Title Company |
|---|---|---|---|
| Thomson Marilynn A | -- | Attorney | |
| Thomson Lewis W | $154,000 | -- | |
| Ervin | $131,000 | -- | |
| Miller Miller | $113,200 | -- | |
| Caudill | $110,000 | -- | |
| Litwiako Litwiako | $98,000 | -- | |
| -- | $98,100 | -- | |
| -- | $17,400 | -- | |
| -- | -- | -- |
Source: Public Records
Tax History
| Year | Tax Paid | Tax Assessment Tax Assessment Total Assessment is a certain percentage of the fair market value that is determined by local assessors to be the total taxable value of land and additions on the property. | Land | Improvement |
|---|---|---|---|---|
| 2025 | $4,330 | $110,890 | $31,500 | $79,390 |
| 2024 | $4,330 | $110,890 | $31,500 | $79,390 |
| 2023 | $3,671 | $86,205 | $16,940 | $69,265 |
| 2022 | $3,617 | $86,205 | $16,940 | $69,265 |
| 2021 | $3,366 | $86,205 | $16,940 | $69,265 |
| 2020 | $3,182 | $71,243 | $14,000 | $57,243 |
| 2019 | $2,934 | $71,243 | $14,000 | $57,243 |
| 2018 | $2,936 | $71,243 | $14,000 | $57,243 |
| 2017 | $2,807 | $61,355 | $12,250 | $49,105 |
| 2016 | $2,928 | $61,355 | $12,250 | $49,105 |
| 2015 | $2,894 | $61,355 | $12,250 | $49,105 |
| 2014 | $2,894 | $57,340 | $11,450 | $45,890 |
| 2013 | $2,892 | $70,120 | $14,000 | $56,120 |
Source: Public Records
Map
Nearby Homes
- 1101 Parklake Row
- 340 Saint James Place
- 350 Spruceway Dr
- 1785 Archerfield Place
- 11138 Oakwood Village Blvd
- 23 Pheasant Run Cir Unit 9A
- 10862 Jandor Place
- 245 Whispering Pines St
- 9680 Williams Dr
- 50 Millard Ct
- 92 Villa Pointe Dr Unit 92
- 225 Renwood Place
- 4193 Old Osprey Cir
- 25 Blose Ct
- 3461 Myna Ln
- 365 Crockett Dr
- 10024 Oriole Ct
- 25 Glass Ct
- 1315 Woodland Greens Blvd
- 80 Gregg Ct
- 585 Queensgate Rd
- 605 Queensgate Rd
- 590 Royal Springs Dr
- 600 Royal Springs Dr
- 575 Queensgate Rd
- 615 Queensgate Rd
- 590 Queensgate Rd
- 580 Royal Springs Dr
- 610 Royal Springs Dr
- 600 Queensgate Rd
- 580 Queensgate Rd
- 610 Queensgate Rd
- 570 Royal Springs Dr
- 565 Queensgate Rd
- 570 Queensgate Rd
- 620 Queensgate Rd
- 1 Pennyroyal Rd
- 595 Royal Springs Dr
- 605 Royal Springs Dr
- 560 Queensgate Rd
Your Personal Tour Guide
Ask me questions while you tour the home.