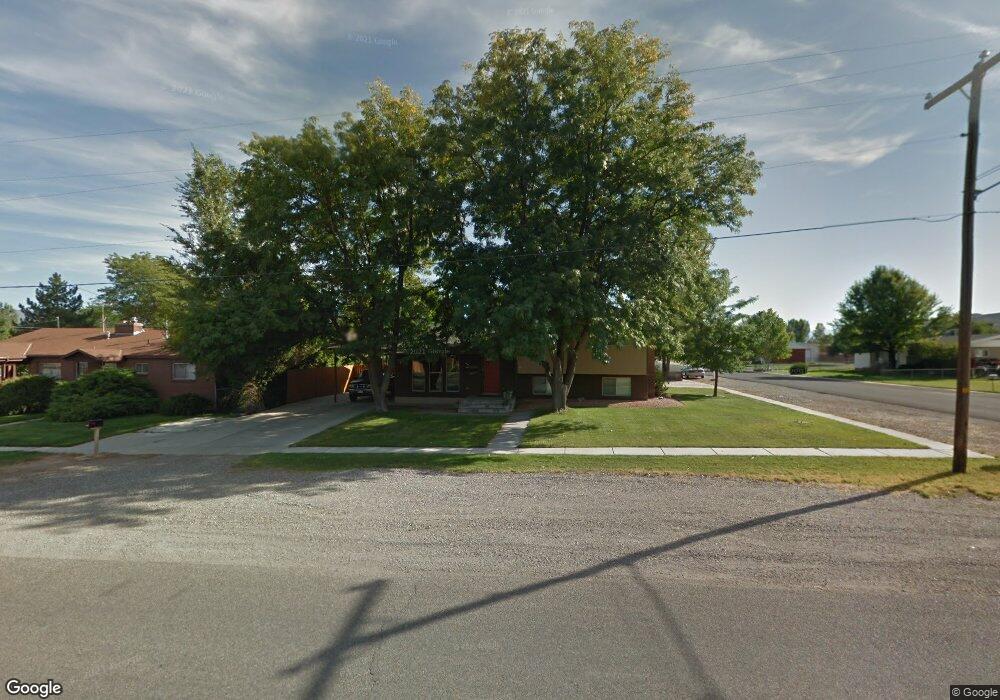
595 W 300 N Richfield, UT 84701
Estimated Value: $322,000 - $391,000
4
Beds
3
Baths
1,772
Sq Ft
$193/Sq Ft
Est. Value
About This Home
This home is located at 595 W 300 N, Richfield, UT 84701 and is currently estimated at $341,150, approximately $192 per square foot. 595 W 300 N is a home located in Sevier County with nearby schools including Pahvant School, Ashman School, and Red Hills Middle School.
Ownership History
Date
Name
Owned For
Owner Type
Purchase Details
Closed on
Jan 3, 2013
Sold by
Maughan Janie L
Bought by
Kirtley Eric M and Kirtley Tera J
Current Estimated Value
Home Financials for this Owner
Home Financials are based on the most recent Mortgage that was taken out on this home.
Original Mortgage
$141,836
Outstanding Balance
$98,157
Interest Rate
3.27%
Mortgage Type
New Conventional
Estimated Equity
$242,993
Purchase Details
Closed on
Mar 19, 2008
Sold by
Maughan Terry P and Maughan Janie L
Bought by
Maughan Janie L
Create a Home Valuation Report for This Property
The Home Valuation Report is an in-depth analysis detailing your home's value as well as a comparison with similar homes in the area
Home Values in the Area
Average Home Value in this Area
Purchase History
| Date | Buyer | Sale Price | Title Company |
|---|---|---|---|
| Kirtley Eric M | -- | D Land Title | |
| Maughan Janie L | -- | None Available |
Source: Public Records
Mortgage History
| Date | Status | Borrower | Loan Amount |
|---|---|---|---|
| Open | Kirtley Eric M | $141,836 |
Source: Public Records
Tax History Compared to Growth
Tax History
| Year | Tax Paid | Tax Assessment Tax Assessment Total Assessment is a certain percentage of the fair market value that is determined by local assessors to be the total taxable value of land and additions on the property. | Land | Improvement |
|---|---|---|---|---|
| 2024 | $1,524 | $154,020 | $37,763 | $116,257 |
| 2023 | $1,524 | $161,681 | $33,522 | $128,159 |
| 2022 | $1,520 | $138,772 | $32,313 | $106,459 |
| 2021 | $1,423 | $109,356 | $30,193 | $79,163 |
| 2020 | $1,252 | $93,552 | $19,998 | $73,554 |
| 2019 | $1,065 | $84,220 | $16,670 | $67,550 |
| 2018 | $1,053 | $74,610 | $16,670 | $57,940 |
| 2017 | $1,014 | $68,610 | $16,670 | $51,940 |
| 2016 | $844 | $68,610 | $0 | $0 |
| 2015 | $844 | $65,170 | $0 | $0 |
| 2014 | $844 | $62,050 | $0 | $0 |
Source: Public Records
Map
Nearby Homes