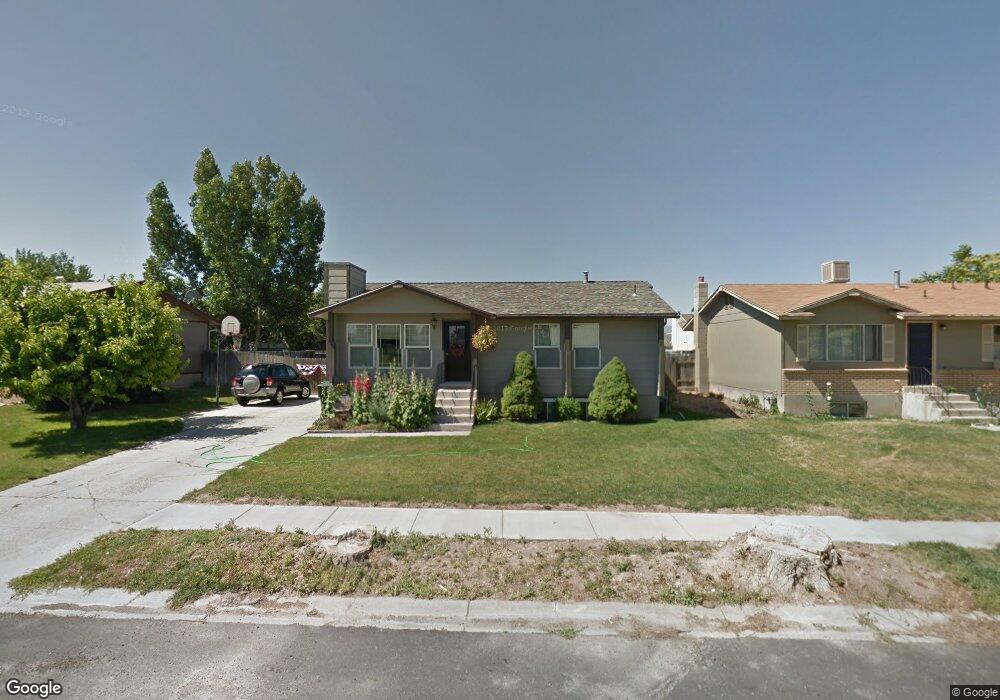
595 W 720 S Tremonton, UT 84337
Estimated Value: $347,000 - $374,478
4
Beds
2
Baths
2,150
Sq Ft
$168/Sq Ft
Est. Value
About This Home
This home is located at 595 W 720 S, Tremonton, UT 84337 and is currently estimated at $360,370, approximately $167 per square foot. 595 W 720 S is a home located in Box Elder County with nearby schools including McKinley School, Alice C. Harris Intermediate School, and Bear River Middle School.
Ownership History
Date
Name
Owned For
Owner Type
Purchase Details
Closed on
Jan 22, 2021
Sold by
Pisciotta Elisabet and Pisciotta David J
Bought by
Christensen Maxwell L and Christensen Natalie Ann
Current Estimated Value
Home Financials for this Owner
Home Financials are based on the most recent Mortgage that was taken out on this home.
Original Mortgage
$277,676
Outstanding Balance
$247,345
Interest Rate
2.6%
Mortgage Type
New Conventional
Estimated Equity
$113,025
Purchase Details
Closed on
Sep 24, 2019
Sold by
Hall Karalee T
Bought by
Pisciotta Elisabet and Pisciotta David J
Home Financials for this Owner
Home Financials are based on the most recent Mortgage that was taken out on this home.
Original Mortgage
$229,292
Interest Rate
3.6%
Mortgage Type
New Conventional
Create a Home Valuation Report for This Property
The Home Valuation Report is an in-depth analysis detailing your home's value as well as a comparison with similar homes in the area
Home Values in the Area
Average Home Value in this Area
Purchase History
| Date | Buyer | Sale Price | Title Company |
|---|---|---|---|
| Christensen Maxwell L | -- | Amicus Title And Escrow Svcs | |
| Pisciotta Elisabet | -- | American Secure Ttl Tremonto |
Source: Public Records
Mortgage History
| Date | Status | Borrower | Loan Amount |
|---|---|---|---|
| Open | Christensen Maxwell L | $277,676 | |
| Previous Owner | Pisciotta Elisabet | $229,292 |
Source: Public Records
Tax History Compared to Growth
Tax History
| Year | Tax Paid | Tax Assessment Tax Assessment Total Assessment is a certain percentage of the fair market value that is determined by local assessors to be the total taxable value of land and additions on the property. | Land | Improvement |
|---|---|---|---|---|
| 2025 | $1,837 | $314,928 | $105,000 | $209,928 |
| 2024 | $1,837 | $311,527 | $105,000 | $206,527 |
| 2023 | $1,896 | $315,798 | $100,000 | $215,798 |
| 2022 | $1,654 | $157,088 | $19,250 | $137,838 |
| 2021 | $1,404 | $187,607 | $35,000 | $152,607 |
| 2020 | $1,240 | $187,607 | $35,000 | $152,607 |
| 2019 | $1,159 | $93,528 | $19,250 | $74,278 |
| 2018 | $927 | $69,544 | $13,750 | $55,794 |
| 2017 | $973 | $126,444 | $13,750 | $101,444 |
| 2016 | $958 | $66,887 | $13,750 | $53,137 |
| 2015 | $874 | $62,057 | $13,750 | $48,307 |
| 2014 | $874 | $59,756 | $13,750 | $46,006 |
| 2013 | -- | $59,757 | $13,338 | $46,419 |
Source: Public Records
Map
Nearby Homes
- 551 W 720 S
- 490 S 500 W
- 556 W 860 S
- 320 W 600 S Unit 93
- 320 W 600 S Unit 91
- 783 W 900 S
- 808 W 400 S
- 250 W 1200 S Unit 103
- 795 S 150 W
- 829 W 960 S
- 251 S 760 W
- 458 W 275 S
- 200 W 1200 S Unit 72
- 200 W 1200 S Unit 152
- 200 W 1200 S Unit 153
- 200 W 1200 S Unit 151
- 200 W 1200 S Unit 156
- 200 W 1200 S Unit 52
- 200 W 1200 S Unit 61
- 626 W 275 S