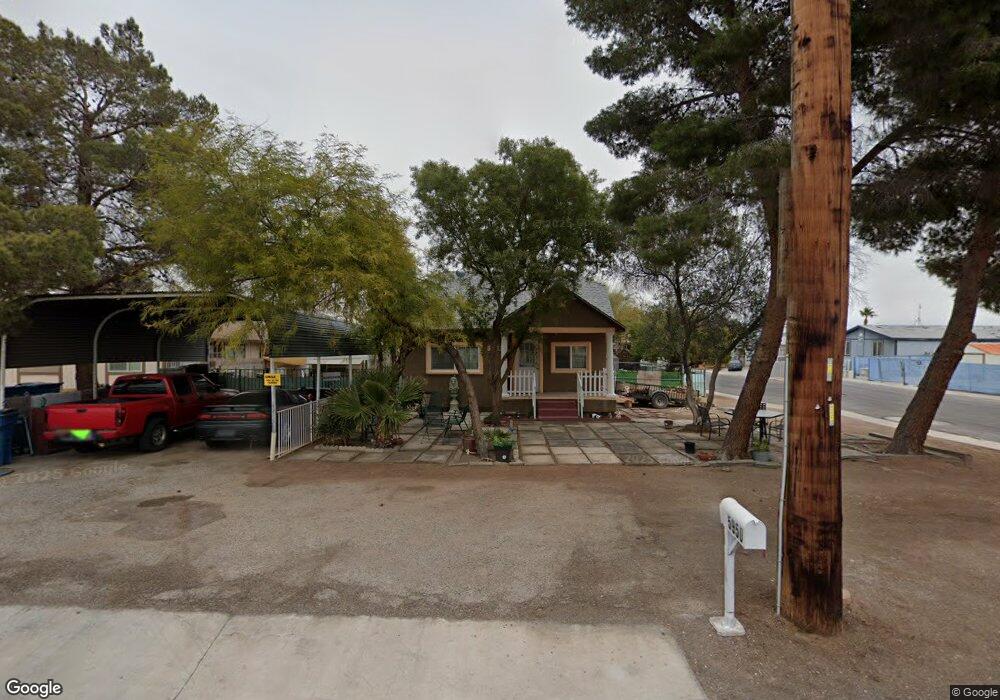
5950 Dodd St Las Vegas, NV 89122
Estimated Value: $178,000 - $338,000
2
Beds
1
Bath
1,164
Sq Ft
$239/Sq Ft
Est. Value
About This Home
This home is located at 5950 Dodd St, Las Vegas, NV 89122 and is currently estimated at $278,455, approximately $239 per square foot. 5950 Dodd St is a home located in Clark County with nearby schools including Whitney Elementary School and Francis H Cortney Junior High School.
Ownership History
Date
Name
Owned For
Owner Type
Purchase Details
Closed on
Apr 13, 2021
Sold by
Tangeman Victoria
Bought by
Quintana Isabel
Current Estimated Value
Home Financials for this Owner
Home Financials are based on the most recent Mortgage that was taken out on this home.
Original Mortgage
$83,858
Outstanding Balance
$75,774
Interest Rate
3.05%
Mortgage Type
New Conventional
Estimated Equity
$202,681
Purchase Details
Closed on
Apr 9, 2021
Sold by
Quintana Eduardo
Bought by
Quintana Isabel
Home Financials for this Owner
Home Financials are based on the most recent Mortgage that was taken out on this home.
Original Mortgage
$83,858
Outstanding Balance
$75,774
Interest Rate
3.05%
Mortgage Type
New Conventional
Estimated Equity
$202,681
Purchase Details
Closed on
Jan 23, 2020
Sold by
Tangeman Victoria and Saenez Edgar H
Bought by
Tangeman Victoria
Purchase Details
Closed on
Feb 24, 2004
Sold by
Saenz Edgar H and Saenz Norma E
Bought by
Edgar H & Norma E Saenz Living Trust
Create a Home Valuation Report for This Property
The Home Valuation Report is an in-depth analysis detailing your home's value as well as a comparison with similar homes in the area
Home Values in the Area
Average Home Value in this Area
Purchase History
| Date | Buyer | Sale Price | Title Company |
|---|---|---|---|
| Quintana Isabel | $87,000 | Ticor Title Las Vegas Sum | |
| Quintana Isabel | -- | Ticor Title Las Vegas Sum | |
| Tangeman Victoria | -- | None Available | |
| Edgar H & Norma E Saenz Living Trust | -- | -- |
Source: Public Records
Mortgage History
| Date | Status | Borrower | Loan Amount |
|---|---|---|---|
| Open | Quintana Isabel | $83,858 |
Source: Public Records
Tax History Compared to Growth
Tax History
| Year | Tax Paid | Tax Assessment Tax Assessment Total Assessment is a certain percentage of the fair market value that is determined by local assessors to be the total taxable value of land and additions on the property. | Land | Improvement |
|---|---|---|---|---|
| 2025 | $376 | $39,711 | $25,900 | $13,811 |
| 2024 | $365 | $39,711 | $25,900 | $13,811 |
| 2023 | $289 | $35,245 | $22,750 | $12,495 |
| 2022 | $355 | $28,645 | $17,500 | $11,145 |
| 2021 | $360 | $27,881 | $17,500 | $10,381 |
| 2020 | $331 | $24,099 | $14,000 | $10,099 |
| 2019 | $322 | $23,031 | $13,300 | $9,731 |
| 2018 | $307 | $20,998 | $11,900 | $9,098 |
| 2017 | $613 | $20,914 | $11,900 | $9,014 |
| 2016 | $289 | $13,974 | $5,250 | $8,724 |
| 2015 | $287 | $13,706 | $5,250 | $8,456 |
| 2014 | $278 | $13,348 | $5,250 | $8,098 |
Source: Public Records
Map
Nearby Homes
- 5943 Willard St
- 5914 Dodd St
- 5176 Nevada Ave
- 5276 Steptoe St
- 5972 Boulder Hwy
- 5857 Cilantrillo Ave
- 6019 Clark St
- 5796 Ambassador Ave Unit 202
- 6229 Clackamas Ct
- 5330 Silvermist Ct Unit 104
- 5340 Silvermist Ct Unit 103
- 5419 Centurion Ct Unit 203
- 5355 Bennett Spring Ln
- 5420 Centurion Ct Unit 104
- 5365 Shake Ct Unit 103
- 5795 Medallion Dr Unit 202
- 5353 Harris Spring Ln
- 5385 Shake Ct Unit 203
- 5831 Medallion Dr Unit 101
- 5831 Medallion Dr Unit 103
- 5944 Dodd St
- 5946 Dodd St
- 5942 Dodd St
- 6070 Dodd St
- 5296 Nevada Ave
- 5939 Willard St
- 5940 Dodd St
- 5280 Nevada Ave
- 6076 Dodd St
- 6030 Forest Archer Place Unit Lot 07
- 5935 Willard St
- 6040 Forest Archer Place Unit Lot 06
- 5934 Dodd St
- 6080 Dodd St
- 6050 Forest Archer Place Unit Lot 05
- 6081 Berthelot Ln
- 5931 Willard St
- 5252 Nevada Ave
- 6060 Forest Archer Place Unit Lot 04