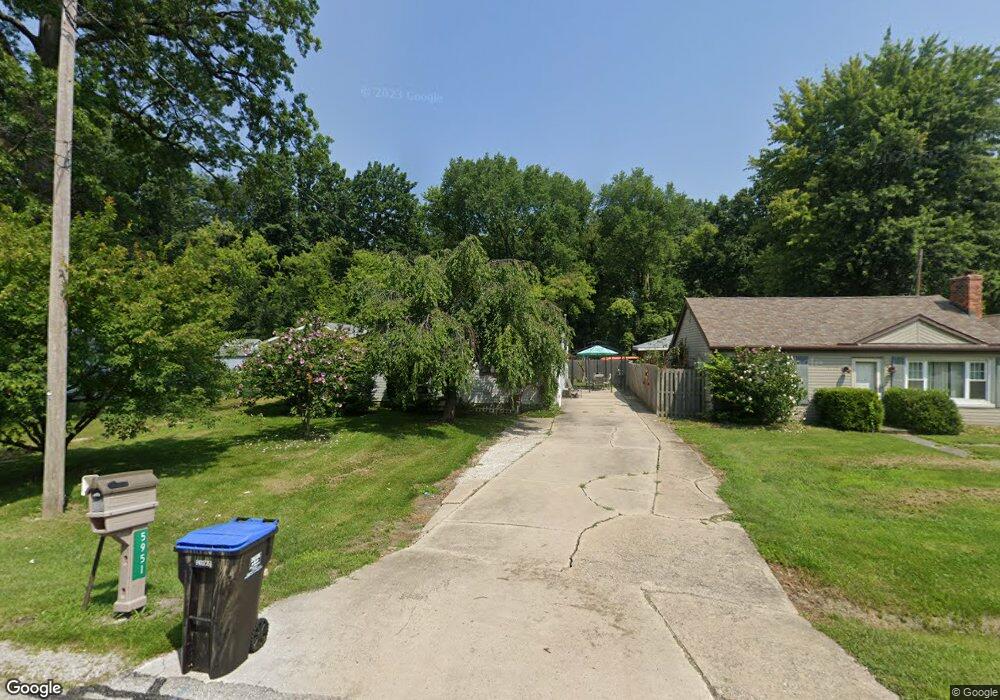
5951 Bryan Rd Oregon, OH 43616
Estimated Value: $101,000 - $129,000
3
Beds
2
Baths
984
Sq Ft
$120/Sq Ft
Est. Value
About This Home
This home is located at 5951 Bryan Rd, Oregon, OH 43616 and is currently estimated at $117,633, approximately $119 per square foot. 5951 Bryan Rd is a home located in Lucas County.
Ownership History
Date
Name
Owned For
Owner Type
Purchase Details
Closed on
Mar 6, 2024
Sold by
Satkowski Donald C
Bought by
Gary Malaki J
Current Estimated Value
Home Financials for this Owner
Home Financials are based on the most recent Mortgage that was taken out on this home.
Original Mortgage
$69,937
Outstanding Balance
$68,584
Interest Rate
6.69%
Mortgage Type
New Conventional
Estimated Equity
$49,049
Purchase Details
Closed on
Oct 6, 2021
Sold by
Warner Sarah J and Satkowski Sarah J
Bought by
Satkowski Donald C
Home Financials for this Owner
Home Financials are based on the most recent Mortgage that was taken out on this home.
Original Mortgage
$60,000
Interest Rate
3.5%
Mortgage Type
New Conventional
Purchase Details
Closed on
Mar 20, 2007
Sold by
Watson Cynthia L and Watson Dudley
Bought by
Warner Sarah J
Purchase Details
Closed on
Mar 28, 2006
Sold by
Varner Nancy J
Bought by
Varner Sarah J and Varner Cynthia L
Purchase Details
Closed on
Apr 29, 1994
Sold by
Guardiola John and Guardiola Kimberly
Purchase Details
Closed on
Jan 2, 1990
Purchase Details
Closed on
May 10, 1989
Create a Home Valuation Report for This Property
The Home Valuation Report is an in-depth analysis detailing your home's value as well as a comparison with similar homes in the area
Home Values in the Area
Average Home Value in this Area
Purchase History
| Date | Buyer | Sale Price | Title Company |
|---|---|---|---|
| Gary Malaki J | $72,100 | None Listed On Document | |
| Satkowski Donald C | $100,000 | None Available | |
| Warner Sarah J | -- | Attorney | |
| Varner Sarah J | -- | None Available | |
| -- | $58,000 | -- | |
| -- | $48,000 | -- | |
| -- | -- | -- |
Source: Public Records
Mortgage History
| Date | Status | Borrower | Loan Amount |
|---|---|---|---|
| Open | Gary Malaki J | $69,937 | |
| Previous Owner | Satkowski Donald C | $60,000 |
Source: Public Records
Tax History
| Year | Tax Paid | Tax Assessment Tax Assessment Total Assessment is a certain percentage of the fair market value that is determined by local assessors to be the total taxable value of land and additions on the property. | Land | Improvement |
|---|---|---|---|---|
| 2025 | -- | $29,120 | $5,495 | $23,625 |
| 2024 | $715 | $29,120 | $5,495 | $23,625 |
| 2023 | $1,555 | $27,160 | $5,005 | $22,155 |
| 2022 | $1,565 | $27,160 | $5,005 | $22,155 |
| 2021 | $1,577 | $27,160 | $5,005 | $22,155 |
| 2020 | $1,609 | $24,675 | $4,515 | $20,160 |
| 2019 | $1,565 | $24,675 | $4,515 | $20,160 |
| 2018 | $1,402 | $24,675 | $4,515 | $20,160 |
| 2017 | $1,525 | $22,505 | $3,745 | $18,760 |
| 2016 | $1,507 | $64,300 | $10,700 | $53,600 |
| 2015 | $1,498 | $64,300 | $10,700 | $53,600 |
| 2014 | $811 | $22,060 | $3,680 | $18,380 |
| 2013 | $811 | $22,060 | $3,680 | $18,380 |
Source: Public Records
Map
Nearby Homes
- 1561 N Stadium Rd
- 6028 Bayshore Rd
- 5560 Eagles Landing Dr
- 5524 Eagles Landing Dr
- 5281 Eagles Landing Dr
- 5313 Eagles Landing Dr
- 5548 Eagles Landing Dr
- 5514 Eagles Landing Dr
- 1536 N Wynn Rd
- 455 Cody
- 454 Cody Dr
- 5914 Kacy Ln
- 5882 Kacy Ln
- 155 N Stadium Rd
- 2079 Arkansas St
- 5415 Seaman Rd
- 5962 Edgewater Dr
- 234 Avilyn Ln
- 5051 Magnolia Dr
- 5054 Magnolia Dr
- 5957 Bryan Rd
- 5947 Bryan Rd
- 6015 James Rd
- 5931 Bryan Rd
- 1645 James Rd
- 5944 Bryan Rd
- 6006 Bryan Rd
- 6005 Bryan Rd
- 6015 Bryan Rd
- 5916 Bryan Rd
- 5915 Bryan Rd
- 6018 Bryan Rd
- 5970 Plympton Cir
- 5964 Plympton Cir
- 6031 Bryan Rd
- 6066 Plympton Cir
- 6062 Plympton Cir
- 6054 Plympton Cir
- 5955 Grisell Rd
- 6001 Grisell Rd
Your Personal Tour Guide
Ask me questions while you tour the home.