5951 South Loop E Unit 16 Houston, TX 77033
OST-South Union NeighborhoodEstimated Value: $202,000 - $265,999
2
Beds
20
Baths
1,364
Sq Ft
$171/Sq Ft
Est. Value
About This Home
This home is located at 5951 South Loop E Unit 16, Houston, TX 77033 and is currently estimated at $233,500, approximately $171 per square foot. 5951 South Loop E Unit 16 is a home located in Harris County with nearby schools including Hartsfield Elementary Animal and Environmental Sciences Magnet, Cullen Middle School, and Yates High School.
Ownership History
Date
Name
Owned For
Owner Type
Purchase Details
Closed on
Sep 14, 2012
Sold by
Contemporary Garden Homes Ltd Llp
Bought by
William A Gray Real Estate Investments L
Current Estimated Value
Home Financials for this Owner
Home Financials are based on the most recent Mortgage that was taken out on this home.
Original Mortgage
$128,700
Outstanding Balance
$88,947
Interest Rate
3.62%
Mortgage Type
VA
Estimated Equity
$144,553
Purchase Details
Closed on
Sep 13, 2012
Sold by
William A Gray Real Estate Investments L
Bought by
Mcclinton Leroy
Home Financials for this Owner
Home Financials are based on the most recent Mortgage that was taken out on this home.
Original Mortgage
$128,700
Outstanding Balance
$88,947
Interest Rate
3.62%
Mortgage Type
VA
Estimated Equity
$144,553
Create a Home Valuation Report for This Property
The Home Valuation Report is an in-depth analysis detailing your home's value as well as a comparison with similar homes in the area
Home Values in the Area
Average Home Value in this Area
Purchase History
| Date | Buyer | Sale Price | Title Company |
|---|---|---|---|
| William A Gray Real Estate Investments L | -- | Stewart Title | |
| Mcclinton Leroy | -- | Stewart Title |
Source: Public Records
Mortgage History
| Date | Status | Borrower | Loan Amount |
|---|---|---|---|
| Open | Mcclinton Leroy | $128,700 |
Source: Public Records
Tax History
| Year | Tax Paid | Tax Assessment Tax Assessment Total Assessment is a certain percentage of the fair market value that is determined by local assessors to be the total taxable value of land and additions on the property. | Land | Improvement |
|---|---|---|---|---|
| 2025 | $50 | $228,856 | $36,400 | $192,456 |
| 2024 | $50 | $228,856 | $36,400 | $192,456 |
| 2023 | $50 | $228,856 | $36,400 | $192,456 |
| 2022 | $4,311 | $201,919 | $36,400 | $165,519 |
| 2021 | $3,943 | $169,162 | $36,400 | $132,762 |
| 2020 | $4,291 | $169,162 | $36,400 | $132,762 |
| 2019 | $4,107 | $155,254 | $36,400 | $118,854 |
| 2018 | $985 | $150,398 | $36,400 | $113,998 |
| 2017 | $3,976 | $150,398 | $36,400 | $113,998 |
| 2016 | $3,794 | $150,398 | $36,400 | $113,998 |
| 2015 | $2,272 | $139,286 | $36,400 | $102,886 |
| 2014 | $2,272 | $118,600 | $36,400 | $82,200 |
Source: Public Records
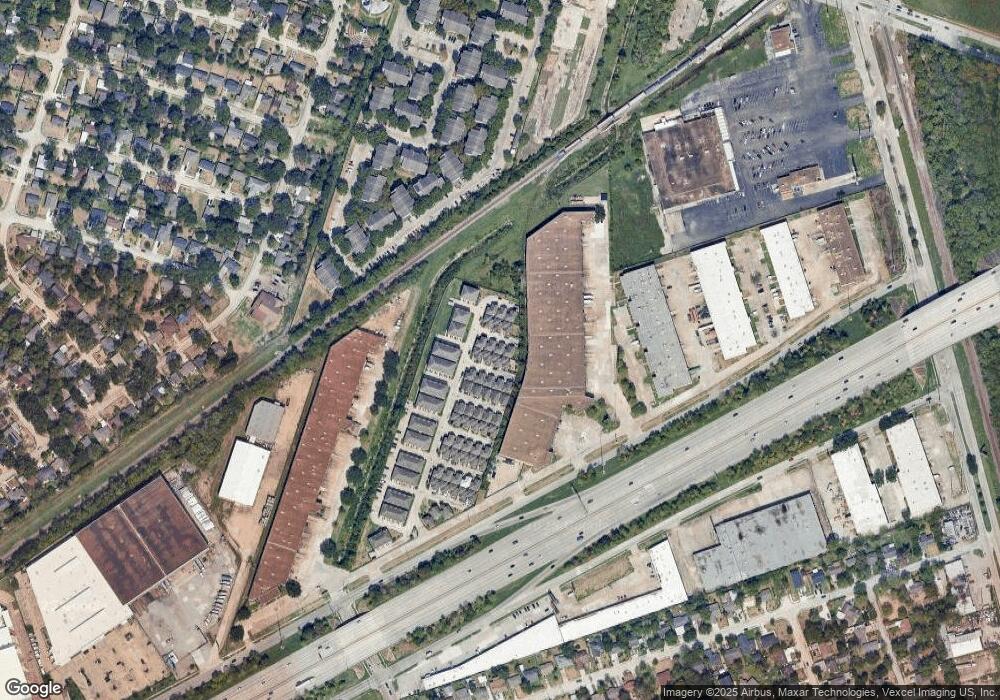
Map
Nearby Homes
- 5951 South Loop E Unit 47
- 5941 South Loop E Unit 503
- 5941 South Loop E Unit 504
- 5941 South Loop E Unit 104
- 6031 Beekman Rd
- 5338 Keystone St
- 5914 Southcrest St
- 5326 Dewberry St
- 5322 Dewberry St
- 6401 Kassarine Pass
- 5251 Perry St
- 5941 Southlea St
- 5254 Perry St
- 5714 Sunrise Rd
- 5833 Southlea St
- 5632 Sunrise Rd
- 5244 Enyart St
- 5601 Malmedy Rd
- 5215 Kingsbury St
- 5602 Southlea St
- 5951 South Loop E Unit 11
- 5951 South Loop E Unit 25
- 5951 South Loop E Unit 25
- 5951 South Loop E Unit 26
- 5951 South Loop E Unit 27
- 5951 South Loop E Unit 28
- 5951 South Loop E Unit 23
- 5951 South Loop E Unit 22
- 5951 South Loop E Unit 21
- 5951 South Loop E Unit 20
- 5951 South Loop E Unit 19
- 5951 South Loop E Unit 14
- 5951 South Loop E Unit 15
- 5951 South Loop E Unit 17
- 5951 South Loop E Unit 18
- 5951 South Loop E Unit 13
- 5951 South Loop E Unit 12
- 5951 South Loop E Unit 10
- 5951 South Loop E Unit 9
- 5951 South Loop E Unit 4
Your Personal Tour Guide
Ask me questions while you tour the home.