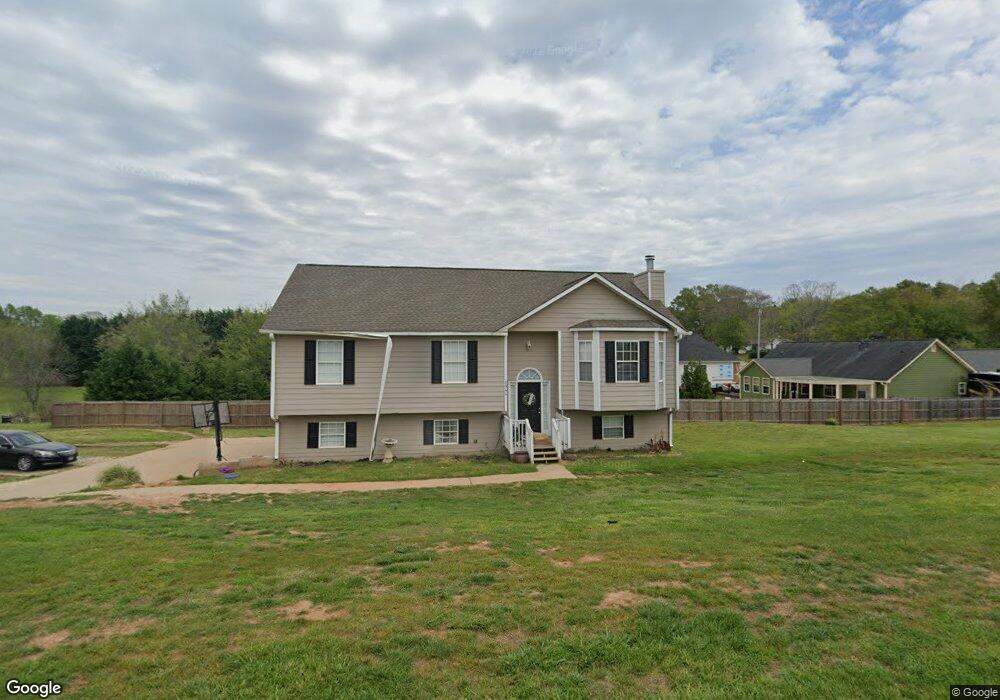
5952 River Oaks Dr Flowery Branch, GA 30542
Estimated Value: $335,000 - $386,000
3
Beds
2
Baths
1,296
Sq Ft
$279/Sq Ft
Est. Value
About This Home
This home is located at 5952 River Oaks Dr, Flowery Branch, GA 30542 and is currently estimated at $361,202, approximately $278 per square foot. 5952 River Oaks Dr is a home located in Hall County with nearby schools including Flowery Branch Elementary School, West Hall Middle School, and West Hall High School.
Ownership History
Date
Name
Owned For
Owner Type
Purchase Details
Closed on
Jun 29, 2022
Sold by
Kyzzie 2 Llc
Bought by
Simmons Brittany Pugh and Simmons Robert Eldon
Current Estimated Value
Home Financials for this Owner
Home Financials are based on the most recent Mortgage that was taken out on this home.
Original Mortgage
$284,747
Outstanding Balance
$272,388
Interest Rate
5.75%
Mortgage Type
FHA
Estimated Equity
$88,814
Purchase Details
Closed on
May 6, 2015
Sold by
Ballard Debra
Bought by
Kyzzie 2 Llc
Purchase Details
Closed on
May 27, 2011
Sold by
Kyzzie 2 Llc
Bought by
Ballard Debra
Home Financials for this Owner
Home Financials are based on the most recent Mortgage that was taken out on this home.
Original Mortgage
$117,852
Interest Rate
4.79%
Mortgage Type
Trade
Purchase Details
Closed on
Apr 18, 2011
Sold by
Simmons Robert E
Bought by
Kyzzie 2 Llc
Home Financials for this Owner
Home Financials are based on the most recent Mortgage that was taken out on this home.
Original Mortgage
$117,852
Interest Rate
4.79%
Mortgage Type
Trade
Create a Home Valuation Report for This Property
The Home Valuation Report is an in-depth analysis detailing your home's value as well as a comparison with similar homes in the area
Home Values in the Area
Average Home Value in this Area
Purchase History
| Date | Buyer | Sale Price | Title Company |
|---|---|---|---|
| Simmons Brittany Pugh | $290,000 | -- | |
| Kyzzie 2 Llc | -- | -- | |
| Ballard Debra | $120,000 | -- | |
| Kyzzie 2 Llc | $161,000 | -- |
Source: Public Records
Mortgage History
| Date | Status | Borrower | Loan Amount |
|---|---|---|---|
| Open | Simmons Brittany Pugh | $284,747 | |
| Previous Owner | Ballard Debra | $117,852 |
Source: Public Records
Tax History Compared to Growth
Tax History
| Year | Tax Paid | Tax Assessment Tax Assessment Total Assessment is a certain percentage of the fair market value that is determined by local assessors to be the total taxable value of land and additions on the property. | Land | Improvement |
|---|---|---|---|---|
| 2024 | $3,123 | $123,360 | $26,640 | $96,720 |
| 2023 | $3,333 | $132,080 | $26,640 | $105,440 |
| 2022 | $2,057 | $72,680 | $9,680 | $63,000 |
| 2021 | $1,881 | $66,880 | $7,920 | $58,960 |
| 2020 | $1,863 | $64,280 | $7,920 | $56,360 |
| 2019 | $1,779 | $60,600 | $7,920 | $52,680 |
| 2018 | $1,559 | $50,850 | $7,920 | $42,930 |
| 2017 | $1,544 | $50,850 | $7,920 | $42,930 |
| 2016 | $1,509 | $50,879 | $7,949 | $42,930 |
| 2015 | $1,519 | $50,879 | $7,949 | $42,930 |
| 2014 | $1,519 | $50,879 | $7,949 | $42,930 |
Source: Public Records
Map
Nearby Homes
- 6025 River Oaks Dr
- 6144 Scott Dr
- 6144 Scott Dr Unit 8
- 5837 Meadow View Ln
- 6026 Jim Crow Rd
- 5867 Meadow View Ln
- 5729 Jim Crow Rd
- 6137 White Oak Dr
- 6135 White Oak Dr
- 5993 Overby Rd
- 6185 Old Stringer Rd
- 6024 Park Bay Ct
- 6544 Teal Trail Dr
- 5644 Mohave Ct
- 6619 Blue Cove Dr
- 5610 Point Dr W
- 6409 Eva Rd
- 5580 Point West Dr
- 6322 Spring Cove Dr
- 5936 River Rd
- 5951 River Oaks Dr
- 5928 River Rd
- 5398 Manor View Ln Unit 8
- 5398 Manor View Ln
- 5958 River Oaks Dr
- 5956 River Rd
- 5955 River Oaks Dr
- 5922 River Rd
- 5959 River Oaks Dr
- 5962 River Rd
- 5966 River Oaks Dr Unit 1
- 5966 River Oaks Dr
- 5905 Manor View Ln Unit 1
- 5905 Manor View Ln
- 5916 River Rd
- 5908 Manor View Ln Unit 14
- 5908 Manor View Ln
- 5967 River Oaks Dr
- 5972 River Oaks Dr