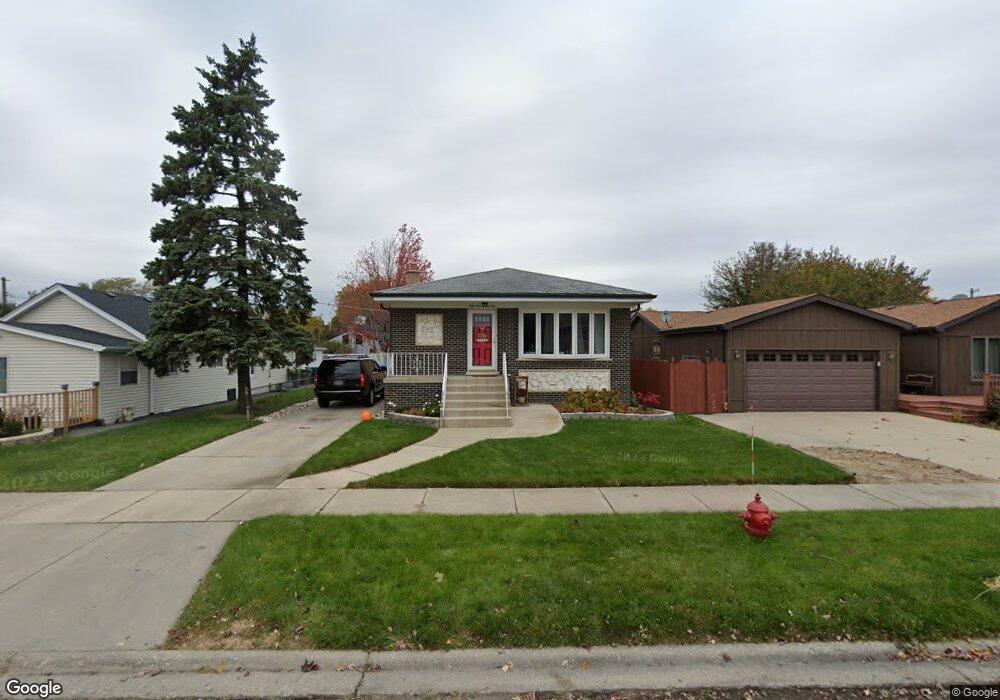
5952 W 89th St Oak Lawn, IL 60453
Estimated Value: $293,000 - $337,000
3
Beds
1
Bath
1,330
Sq Ft
$237/Sq Ft
Est. Value
About This Home
This home is located at 5952 W 89th St, Oak Lawn, IL 60453 and is currently estimated at $314,893, approximately $236 per square foot. 5952 W 89th St is a home located in Cook County with nearby schools including Harnew Elementary School, Simmons Middle School, and Oak Lawn Community High School.
Ownership History
Date
Name
Owned For
Owner Type
Purchase Details
Closed on
Dec 22, 2020
Sold by
Channell Shayla Loren and Channell Matthew Alan
Bought by
Channell Shayla Loren and Channell Matthew Alan
Current Estimated Value
Home Financials for this Owner
Home Financials are based on the most recent Mortgage that was taken out on this home.
Original Mortgage
$192,511
Outstanding Balance
$155,617
Interest Rate
2.67%
Mortgage Type
FHA
Estimated Equity
$159,276
Purchase Details
Closed on
Sep 28, 2015
Sold by
Burke Heide L and Koch Leo Robert
Bought by
Burke Shayla L
Home Financials for this Owner
Home Financials are based on the most recent Mortgage that was taken out on this home.
Original Mortgage
$165,938
Interest Rate
4.5%
Mortgage Type
FHA
Purchase Details
Closed on
Oct 8, 2009
Sold by
Koch Lori and Koch Lore
Bought by
Koch Lore
Create a Home Valuation Report for This Property
The Home Valuation Report is an in-depth analysis detailing your home's value as well as a comparison with similar homes in the area
Home Values in the Area
Average Home Value in this Area
Purchase History
| Date | Buyer | Sale Price | Title Company |
|---|---|---|---|
| Channell Shayla Loren | -- | Advantage Title Co Llc | |
| Burke Shayla L | $169,000 | Greater Metropolitan Title L | |
| Koch Lore | -- | None Available |
Source: Public Records
Mortgage History
| Date | Status | Borrower | Loan Amount |
|---|---|---|---|
| Open | Channell Shayla Loren | $192,511 | |
| Previous Owner | Burke Shayla L | $165,938 |
Source: Public Records
Tax History Compared to Growth
Tax History
| Year | Tax Paid | Tax Assessment Tax Assessment Total Assessment is a certain percentage of the fair market value that is determined by local assessors to be the total taxable value of land and additions on the property. | Land | Improvement |
|---|---|---|---|---|
| 2024 | $5,720 | $23,000 | $3,850 | $19,150 |
| 2023 | $4,378 | $23,000 | $3,850 | $19,150 |
| 2022 | $4,378 | $15,887 | $3,319 | $12,568 |
| 2021 | $4,273 | $15,886 | $3,318 | $12,568 |
| 2020 | $4,263 | $15,886 | $3,318 | $12,568 |
| 2019 | $4,217 | $16,419 | $3,053 | $13,366 |
| 2018 | $4,039 | $16,419 | $3,053 | $13,366 |
| 2017 | $4,116 | $16,419 | $3,053 | $13,366 |
| 2016 | $4,481 | $13,348 | $2,522 | $10,826 |
| 2015 | $4,447 | $13,348 | $2,522 | $10,826 |
| 2014 | $4,407 | $13,348 | $2,522 | $10,826 |
| 2013 | $3,703 | $16,821 | $2,522 | $14,299 |
Source: Public Records
Map
Nearby Homes
- 5905 W 89th St
- 5831 W 89th St
- 8803 Austin Ave
- 5840 W 90th St
- 8848 Meade Ave
- 5746 W 88th St
- 9100 Lynwood Dr
- 8646 Menard Ave
- 5649 W 87th Place
- 9001 Major Ave
- 8535 Mansfield Ave
- 8762 Central Ave
- 8758 Central Ave
- 8720 Mobile Ave Unit C
- 6313 W 89th Place
- 8525 Massasoit Ave
- 8704 Mobile Ave Unit A
- 9258 Austin Ave
- 5555 W 90th St
- 8952 S 55th Ct
- 5954 W 89th St
- 5950 W 89th St
- 5950 W 89th St
- 5932 W 89th St
- 5956 W 89th St
- 5956 W 89th St
- 5921 W 88th Place
- 5921 W 88th Place
- 5951 W 88th Place
- 5928 W 89th St
- 5917 W 88th Place
- 5917 W 88th Place
- 5953 W 88th Place
- 5953 W 88th Place
- 5935 W 89th St
- 5937 W 89th St
- 5933 W 89th St
- 5933 W 89th St
- 5953 W 89th St
- 8829 Austin Ave