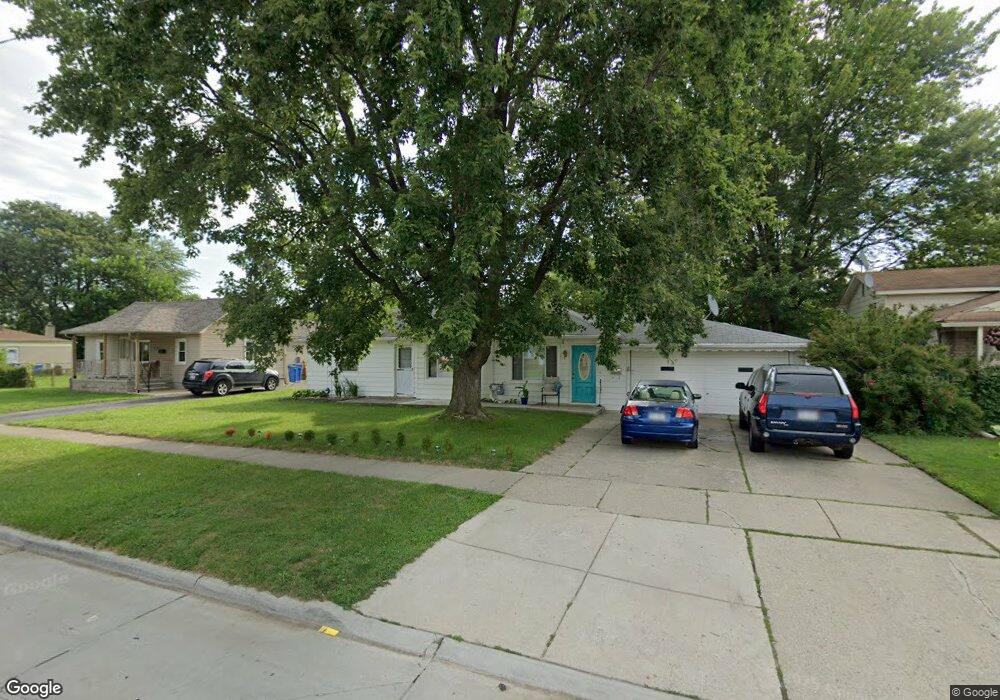
5952 Whitefield St Dearborn Heights, MI 48127
Estimated Value: $240,453 - $270,000
2
Beds
1
Bath
1,135
Sq Ft
$229/Sq Ft
Est. Value
About This Home
This home is located at 5952 Whitefield St, Dearborn Heights, MI 48127 and is currently estimated at $260,363, approximately $229 per square foot. 5952 Whitefield St is a home located in Wayne County with nearby schools including Crestwood High School, Highview Elementary School, and Riverside Middle School.
Ownership History
Date
Name
Owned For
Owner Type
Purchase Details
Closed on
Apr 25, 2018
Sold by
Albo Jawad Ali Aziz
Bought by
Albo Jawad Wealeid
Current Estimated Value
Purchase Details
Closed on
Jul 15, 2010
Sold by
Donovan Shaun
Bought by
Albojawad Ali
Purchase Details
Closed on
Oct 19, 2009
Sold by
Bac Home Loans Servicing Lp
Bought by
The Secretary Of Housing & Urban Develop
Purchase Details
Closed on
Apr 22, 2009
Sold by
Mortgage Electronic Registration Systems
Bought by
Countrywide Home Loans Servicing Lp
Purchase Details
Closed on
Apr 16, 2009
Sold by
Yowchuang Don D
Bought by
Mortgage Electronic Registration Systems
Purchase Details
Closed on
Mar 29, 2006
Sold by
Yowchuang Elizabeth A and Kaiser Elizabeth A
Bought by
Yowchuang Don D
Purchase Details
Closed on
Feb 6, 2002
Sold by
Yowchuang Pibool
Bought by
Yowchuang Elizabeth A
Create a Home Valuation Report for This Property
The Home Valuation Report is an in-depth analysis detailing your home's value as well as a comparison with similar homes in the area
Home Values in the Area
Average Home Value in this Area
Purchase History
| Date | Buyer | Sale Price | Title Company |
|---|---|---|---|
| Albo Jawad Wealeid | -- | None Available | |
| Albojawad Ali | $36,666 | None Available | |
| The Secretary Of Housing & Urban Develop | -- | None Available | |
| Countrywide Home Loans Servicing Lp | -- | None Available | |
| Mortgage Electronic Registration Systems | $137,716 | None Available | |
| Yowchuang Don D | $125,000 | Lawyers Title Ins | |
| Yowchuang Elizabeth A | -- | -- |
Source: Public Records
Tax History Compared to Growth
Tax History
| Year | Tax Paid | Tax Assessment Tax Assessment Total Assessment is a certain percentage of the fair market value that is determined by local assessors to be the total taxable value of land and additions on the property. | Land | Improvement |
|---|---|---|---|---|
| 2025 | $1,762 | $118,700 | $0 | $0 |
| 2024 | $1,762 | $103,000 | $0 | $0 |
| 2023 | $1,666 | $90,200 | $0 | $0 |
| 2022 | $2,255 | $80,200 | $0 | $0 |
| 2021 | $2,261 | $74,500 | $0 | $0 |
| 2019 | $2,201 | $63,800 | $0 | $0 |
| 2018 | $1,520 | $52,400 | $0 | $0 |
| 2017 | $2,018 | $51,500 | $0 | $0 |
| 2016 | $2,850 | $47,200 | $0 | $0 |
| 2015 | $4,091 | $44,100 | $0 | $0 |
| 2013 | $3,963 | $41,300 | $0 | $0 |
| 2010 | -- | $44,400 | $0 | $0 |
Source: Public Records
Map
Nearby Homes
- 5947 Kinmore St
- 5955 N Beech Daly Rd
- 6129 Kinmore St
- 5911 Highview St
- 6026 Nightingale St
- 6431 Centralia St
- 5749 Robindale Ave
- 6435 Centralia St
- 2219 Kinmore St
- 2207 Kinmore St
- 6426 Highview St
- 6453 Centralia St
- 5655 Robindale Ave
- 26439 Midway St
- 6735 Norborne Ave
- 6804 Centralia St
- 1755 Robindale Ave
- 6125 Ardmore
- 6905 N Beech Daly Rd
- 26444 Doxtator St
- 5944 Whitefield St
- 5940 Whitefield St
- 6011 N Evangeline St
- 6006 Whitefield St
- 5961 N Evangeline St
- 5955 N Evangeline St
- 5934 Whitefield St
- 5949 N Evangeline St
- 6001 N Evangeline St
- 5959 Whitefield St Unit Bldg-Unit
- 5959 Whitefield St
- 6012 Whitefield St
- 5953 Whitefield St
- 5943 N Evangeline St
- 5949 Whitefield St
- 6003 Whitefield St
- 5930 Whitefield St
- 5943 Whitefield St
- 5937 N Evangeline St
- 6020 Whitefield St