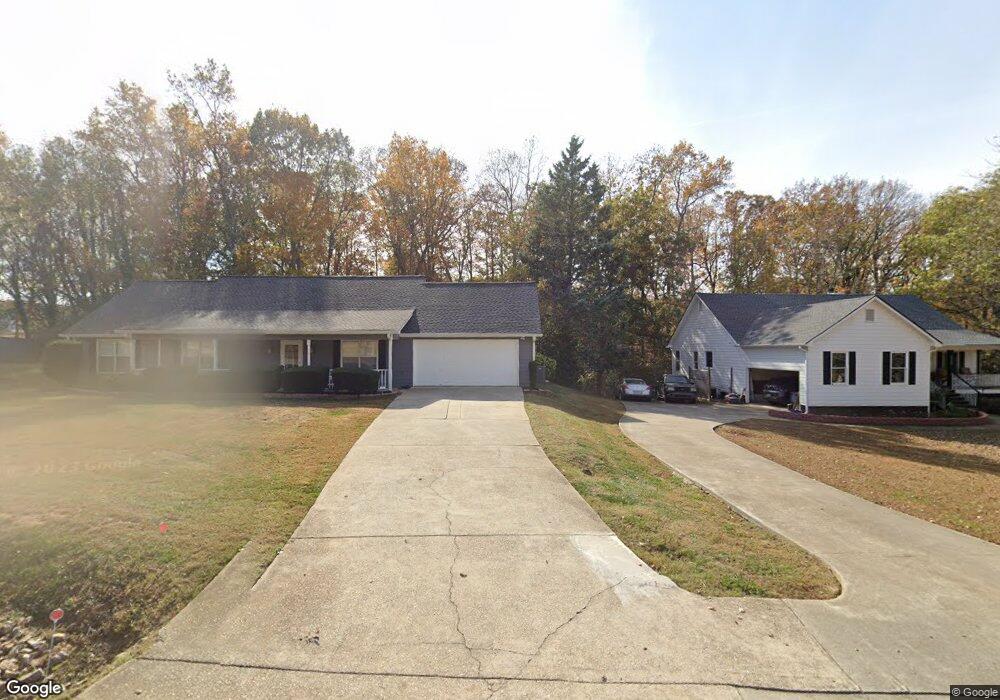
5953 Jim Crow Rd Flowery Branch, GA 30542
Estimated Value: $372,420 - $472,000
3
Beds
2
Baths
1,656
Sq Ft
$247/Sq Ft
Est. Value
About This Home
This home is located at 5953 Jim Crow Rd, Flowery Branch, GA 30542 and is currently estimated at $409,605, approximately $247 per square foot. 5953 Jim Crow Rd is a home located in Hall County with nearby schools including Flowery Branch Elementary School, West Hall Middle School, and West Hall High School.
Ownership History
Date
Name
Owned For
Owner Type
Purchase Details
Closed on
Aug 27, 2010
Sold by
Gunderson Kristin
Bought by
Stagner Michael A
Current Estimated Value
Home Financials for this Owner
Home Financials are based on the most recent Mortgage that was taken out on this home.
Original Mortgage
$159,847
Outstanding Balance
$107,200
Interest Rate
4.75%
Mortgage Type
FHA
Estimated Equity
$302,405
Purchase Details
Closed on
May 31, 2005
Sold by
Davis Kenneth V and Davis Cathy
Bought by
Gunderson Kristin
Home Financials for this Owner
Home Financials are based on the most recent Mortgage that was taken out on this home.
Original Mortgage
$173,100
Interest Rate
5.69%
Mortgage Type
New Conventional
Purchase Details
Closed on
Jul 1, 1996
Create a Home Valuation Report for This Property
The Home Valuation Report is an in-depth analysis detailing your home's value as well as a comparison with similar homes in the area
Home Values in the Area
Average Home Value in this Area
Purchase History
| Date | Buyer | Sale Price | Title Company |
|---|---|---|---|
| Stagner Michael A | $162,000 | -- | |
| Gunderson Kristin | $178,500 | -- | |
| -- | $16,900 | -- |
Source: Public Records
Mortgage History
| Date | Status | Borrower | Loan Amount |
|---|---|---|---|
| Open | Stagner Michael A | $159,847 | |
| Previous Owner | Gunderson Kristin | $173,100 |
Source: Public Records
Tax History Compared to Growth
Tax History
| Year | Tax Paid | Tax Assessment Tax Assessment Total Assessment is a certain percentage of the fair market value that is determined by local assessors to be the total taxable value of land and additions on the property. | Land | Improvement |
|---|---|---|---|---|
| 2024 | $3,117 | $125,240 | $29,080 | $96,160 |
| 2023 | $2,570 | $118,920 | $29,080 | $89,840 |
| 2022 | $2,004 | $76,920 | $10,600 | $66,320 |
| 2021 | $1,902 | $71,680 | $9,520 | $62,160 |
| 2020 | $1,871 | $68,520 | $9,520 | $59,000 |
| 2019 | $1,771 | $64,280 | $9,520 | $54,760 |
| 2018 | $1,729 | $60,770 | $9,520 | $51,250 |
| 2017 | $1,712 | $60,770 | $9,520 | $51,250 |
| 2016 | $1,672 | $60,792 | $9,543 | $51,250 |
| 2015 | $1,685 | $60,792 | $9,543 | $51,250 |
| 2014 | $1,685 | $60,792 | $9,543 | $51,250 |
Source: Public Records
Map
Nearby Homes
- 6025 River Oaks Dr
- 6026 Jim Crow Rd
- 6144 Scott Dr
- 6144 Scott Dr Unit 8
- 6137 White Oak Dr
- 6135 White Oak Dr
- 6125 Jim Crow Rd
- 6185 Old Stringer Rd
- 5954 Overby Rd
- 6212 Costa Lake Point
- 5729 Jim Crow Rd
- 5993 Overby Rd
- 5046 McKinzey Ln
- 6024 Park Bay Ct
- 5657 Stephens Rd
- 5610 Point Dr W
- 5643 Stephens Rd
- 5514 Mainsail Way
- 5359 Point Dr S
- 5945 Jim Crow Rd
- 5957 Jim Crow Rd
- 0 Jim Crow Rd Unit 7497405
- 0 Jim Crow Rd Unit 7486157
- 0 Jim Crow Rd Unit 7417165
- 0 Jim Crow Rd Unit 8556535
- 0 Jim Crow Rd Unit 8296071
- 0 Jim Crow Rd Unit 7100834
- 0 Jim Crow Rd Unit 8407850
- 0 Jim Crow Rd Unit 3220976
- 0 Jim Crow Rd Unit 7100310
- 0 Jim Crow Rd Unit 8288444
- 0 Jim Crow Rd Unit 8163861
- 0 Jim Crow Rd Unit 8148589
- 0 Jim Crow Rd Unit 7435273
- 0 Jim Crow Rd Unit 7398412
- 0 Jim Crow Rd Unit 7324965
- 0 Jim Crow Rd Unit 7021219
- 0 Jim Crow Rd Unit 8990514
- 0 Jim Crow Rd Unit 8731775