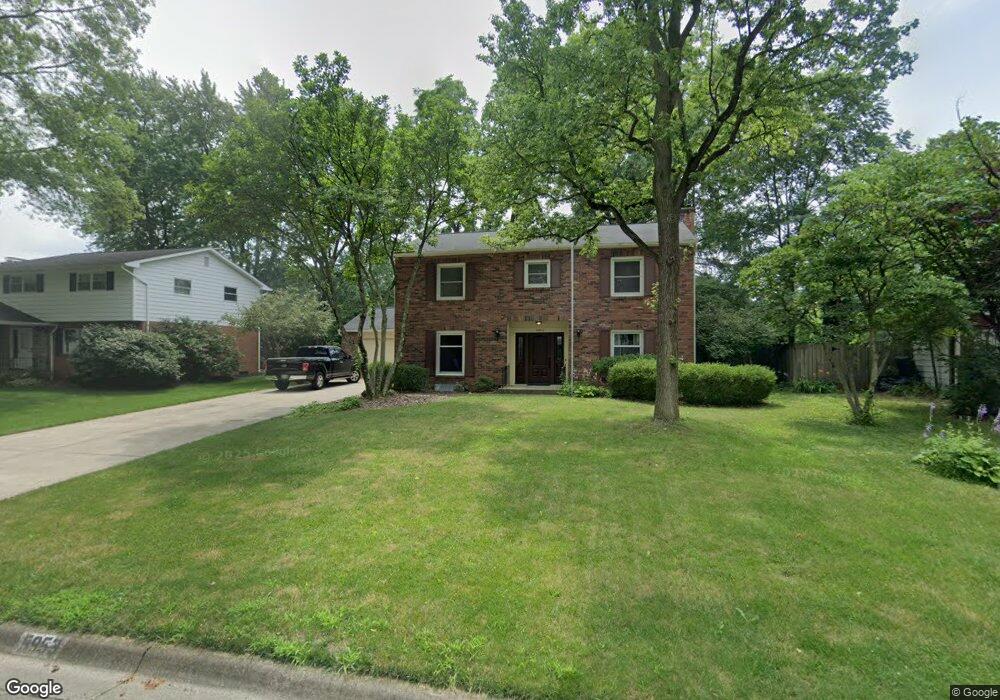
5953 Winstead Rd Columbus, OH 43235
Indian Hills NeighborhoodEstimated Value: $478,844 - $537,000
4
Beds
3
Baths
2,335
Sq Ft
$216/Sq Ft
Est. Value
About This Home
This home is located at 5953 Winstead Rd, Columbus, OH 43235 and is currently estimated at $505,461, approximately $216 per square foot. 5953 Winstead Rd is a home located in Franklin County with nearby schools including Gables Elementary School, Ridgeview Middle School, and Centennial High School.
Ownership History
Date
Name
Owned For
Owner Type
Purchase Details
Closed on
Jul 7, 2006
Sold by
Hoag John and Hoag Billie J
Bought by
Dondero Timothy J and Dondero Tammie S
Current Estimated Value
Home Financials for this Owner
Home Financials are based on the most recent Mortgage that was taken out on this home.
Original Mortgage
$216,720
Interest Rate
5.73%
Mortgage Type
Purchase Money Mortgage
Purchase Details
Closed on
Oct 20, 2000
Sold by
Weaver Nuvia P
Bought by
Hoag John and Hoag Billie J
Purchase Details
Closed on
Jun 23, 1992
Bought by
Weaver Nuvia P
Create a Home Valuation Report for This Property
The Home Valuation Report is an in-depth analysis detailing your home's value as well as a comparison with similar homes in the area
Home Values in the Area
Average Home Value in this Area
Purchase History
| Date | Buyer | Sale Price | Title Company |
|---|---|---|---|
| Dondero Timothy J | $270,900 | Stewart Tit | |
| Hoag John | $180,000 | Warranty Title | |
| Weaver Nuvia P | -- | -- |
Source: Public Records
Mortgage History
| Date | Status | Borrower | Loan Amount |
|---|---|---|---|
| Previous Owner | Dondero Timothy J | $216,720 |
Source: Public Records
Tax History Compared to Growth
Tax History
| Year | Tax Paid | Tax Assessment Tax Assessment Total Assessment is a certain percentage of the fair market value that is determined by local assessors to be the total taxable value of land and additions on the property. | Land | Improvement |
|---|---|---|---|---|
| 2024 | $6,494 | $144,690 | $51,030 | $93,660 |
| 2023 | $6,411 | $144,690 | $51,030 | $93,660 |
| 2022 | $6,414 | $123,660 | $29,020 | $94,640 |
| 2021 | $6,425 | $123,660 | $29,020 | $94,640 |
| 2020 | $6,433 | $123,660 | $29,020 | $94,640 |
| 2019 | $5,918 | $97,550 | $23,210 | $74,340 |
| 2018 | $5,420 | $97,550 | $23,210 | $74,340 |
| 2017 | $5,914 | $97,550 | $23,210 | $74,340 |
| 2016 | $5,435 | $82,050 | $19,080 | $62,970 |
| 2015 | $4,934 | $82,050 | $19,080 | $62,970 |
| 2014 | $4,946 | $82,050 | $19,080 | $62,970 |
| 2013 | $2,323 | $78,120 | $18,165 | $59,955 |
Source: Public Records
Map
Nearby Homes
- 5881 Rocky Rill Rd
- 6041 Rocky Rill Rd
- 5854 Aqua Bay Dr Unit 5854
- 5936 Aqua Bay Dr
- 5938 Aqua Bay Dr
- 838 Cambridge Ct
- 5773 Middlefield Dr
- 962 Augusta Glen Dr
- 6105 Flora Villa Dr
- 928 Linworth Village Dr
- 895 Linworth Village Dr
- 6577 Plesenton Dr S
- 1505 Eastmeadow Place
- 1246 Southport Dr
- 1037 Ravine Ridge Dr
- 511 W Kanawha Ave
- 5016 Postlewaite Rd Unit 5016
- 1213 Nantucket Ave
- 1307 Lakeside Ct
- 301 W Riverglen Dr
- 5941 Winstead Rd
- 5967 Winstead Rd
- 5950 Sedgwick Rd
- 5938 Sedgwick Rd
- 5956 Winstead Rd
- 5929 Winstead Rd
- 5962 Sedgwick Rd
- 5926 Sedgwick Rd
- 5975 Winstead Rd
- 5970 Winstead Rd
- 5928 Winstead Rd
- 1022 Spring Grove Ln
- 5951 Tulip Hill Rd
- 5974 Sedgwick Rd
- 1040 Spring Grove Ln
- 5989 Winstead Rd
- 5984 Winstead Rd
- 5947 Sedgwick Rd
- 5948 Tulip Hill Rd
- 5935 Sedgwick Rd