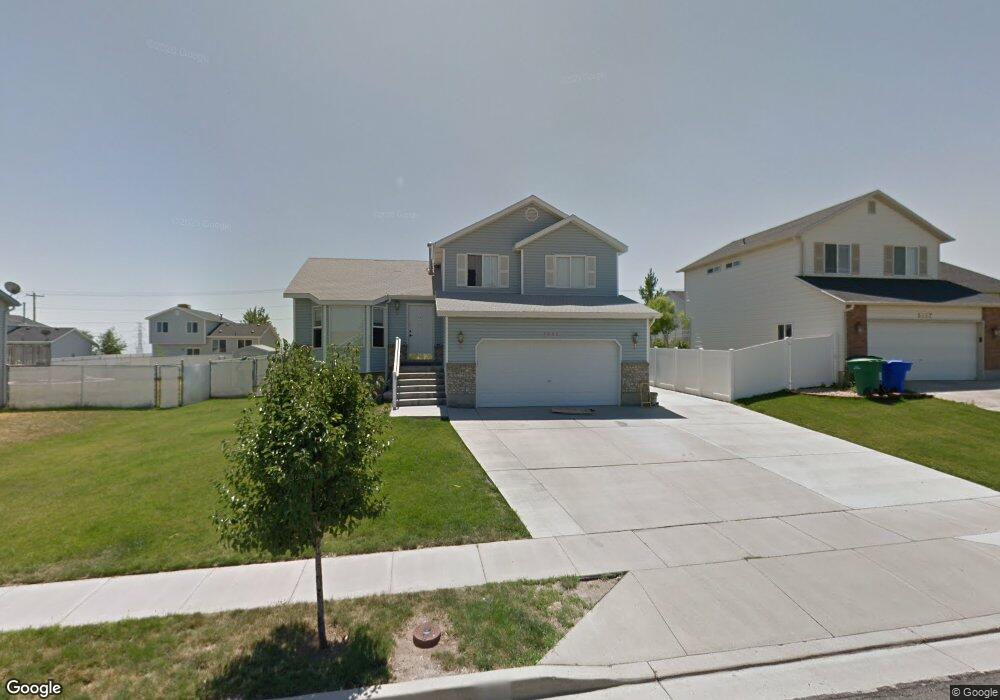
5955 Jackling Way West Jordan, UT 84081
Oquirrh NeighborhoodEstimated Value: $490,000 - $533,000
3
Beds
1
Bath
1,751
Sq Ft
$291/Sq Ft
Est. Value
About This Home
This home is located at 5955 Jackling Way, West Jordan, UT 84081 and is currently estimated at $509,775, approximately $291 per square foot. 5955 Jackling Way is a home located in Salt Lake County with nearby schools including Falcon Ridge School, Sunset Ridge Middle School, and Copper Hills High School.
Ownership History
Date
Name
Owned For
Owner Type
Purchase Details
Closed on
Jun 19, 2002
Sold by
Hud
Bought by
Cornell James R and Cornell Alice F
Current Estimated Value
Home Financials for this Owner
Home Financials are based on the most recent Mortgage that was taken out on this home.
Original Mortgage
$126,022
Outstanding Balance
$52,390
Interest Rate
6.71%
Mortgage Type
FHA
Estimated Equity
$457,385
Purchase Details
Closed on
Mar 13, 2002
Sold by
North American Mtg Company
Bought by
Hud
Purchase Details
Closed on
Mar 6, 2002
Sold by
Bradshaw Donald F and Bradshaw Corilee L
Bought by
North American Mtg Company
Purchase Details
Closed on
Nov 1, 1999
Sold by
Rochelle Park Lc
Bought by
Bradshaw Donald F and Bradshaw Corilee L
Home Financials for this Owner
Home Financials are based on the most recent Mortgage that was taken out on this home.
Original Mortgage
$140,688
Interest Rate
7.82%
Mortgage Type
FHA
Create a Home Valuation Report for This Property
The Home Valuation Report is an in-depth analysis detailing your home's value as well as a comparison with similar homes in the area
Home Values in the Area
Average Home Value in this Area
Purchase History
| Date | Buyer | Sale Price | Title Company |
|---|---|---|---|
| Cornell James R | -- | First Amer Title Ins Agency | |
| Hud | -- | First Southwestern Title | |
| North American Mtg Company | -- | First Southwestern Title | |
| Bradshaw Donald F | -- | Merrill Title |
Source: Public Records
Mortgage History
| Date | Status | Borrower | Loan Amount |
|---|---|---|---|
| Open | Cornell James R | $126,022 | |
| Previous Owner | Bradshaw Donald F | $140,688 |
Source: Public Records
Tax History Compared to Growth
Tax History
| Year | Tax Paid | Tax Assessment Tax Assessment Total Assessment is a certain percentage of the fair market value that is determined by local assessors to be the total taxable value of land and additions on the property. | Land | Improvement |
|---|---|---|---|---|
| 2025 | $2,627 | $466,300 | $152,400 | $313,900 |
| 2024 | $2,627 | $444,100 | $146,500 | $297,600 |
| 2023 | $2,627 | $418,900 | $140,900 | $278,000 |
| 2022 | $2,760 | $435,700 | $138,200 | $297,500 |
| 2021 | $2,415 | $354,000 | $106,300 | $247,700 |
| 2020 | $2,205 | $301,800 | $98,600 | $203,200 |
| 2019 | $2,154 | $288,400 | $93,000 | $195,400 |
| 2018 | $1,997 | $263,800 | $93,000 | $170,800 |
| 2017 | $1,910 | $248,600 | $93,000 | $155,600 |
| 2016 | $1,938 | $237,300 | $86,100 | $151,200 |
| 2015 | $1,824 | $215,500 | $96,400 | $119,100 |
| 2014 | $1,783 | $206,900 | $93,600 | $113,300 |
Source: Public Records
Map
Nearby Homes
- 6977 W Hidden Way S Unit 147
- 6116 W Graceland Way
- 6150 W Nellies St
- 6761 S High Bluff Dr
- 6301 W Passenger Ln Unit 2
- 7134 S Rialto Way
- 6721 Adventure Way
- 5818 W Whisper View Ct
- 5818 W Whisper View Ct Unit 336
- 6739 S Sol Rise Dr
- 5732 W Moon Crest Ct
- 6364 W Passenger Ln
- 7296 S Sophia Ridge Ct
- 5502 Starflower Way
- 7368 S Travertine Rd Unit 314
- 5557 W Joshua Cir
- 5644 W 7340 S
- 7457 S Cupric Bend Way
- 6922 Mullien Dr
- Cleveland Plan at Bingham Heights
- 5947 W Jackling Way
- 5967 Jackling Way
- 5947 Jackling Way
- 5967 W Jackling Way
- 5956 W 7000 S
- 5968 W 7000 S
- 5946 W 7000 S
- 5937 W Jackling Way
- 5977 Jackling Way
- 5937 Jackling Way
- 5950 Jackling Way
- 5950 W Jackling Way
- 5964 Jackling Way
- 5964 W Jackling Way
- 5936 W 7000 S
- 5942 Jackling Way
- 6945 Mineral Mount Dr
- 5925 W Jackling Way
- 5925 Jackling Way
- 5987 Jackling Way