Estimated Value: $434,000 - $477,946
5
Beds
2
Baths
2,112
Sq Ft
$217/Sq Ft
Est. Value
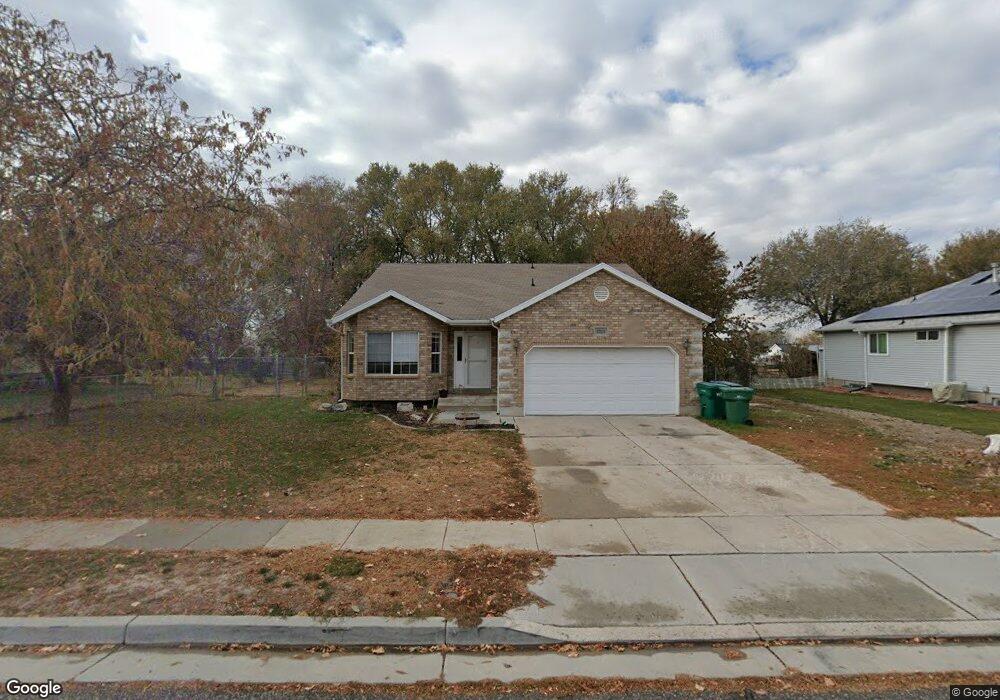
About This Home
This home is located at 5955 S 3375 W, Roy, UT 84067 and is currently estimated at $458,487, approximately $217 per square foot. 5955 S 3375 W is a home located in Weber County with nearby schools including Roy Elementary School, Roy Junior High School, and Roy High School.
Ownership History
Date
Name
Owned For
Owner Type
Purchase Details
Closed on
Dec 22, 2021
Sold by
Property Seller Solutions Llc
Bought by
Dwf Vi Atlas Sfr Ut Llc
Current Estimated Value
Home Financials for this Owner
Home Financials are based on the most recent Mortgage that was taken out on this home.
Original Mortgage
$392,770
Interest Rate
3.01%
Mortgage Type
New Conventional
Purchase Details
Closed on
Nov 12, 2021
Sold by
Lowell Cook
Bought by
Property Seller Solutions Llc
Home Financials for this Owner
Home Financials are based on the most recent Mortgage that was taken out on this home.
Original Mortgage
$392,770
Interest Rate
3.01%
Mortgage Type
New Conventional
Purchase Details
Closed on
Jul 30, 2021
Sold by
Cook Lowell
Bought by
Cook Lowell and Cook Linda
Home Financials for this Owner
Home Financials are based on the most recent Mortgage that was taken out on this home.
Original Mortgage
$200,830
Interest Rate
2.93%
Mortgage Type
Land Contract Argmt. Of Sale
Purchase Details
Closed on
Sep 24, 2008
Sold by
Higbee Paul D and Higbee Zenaida K
Bought by
Cook Lowell
Home Financials for this Owner
Home Financials are based on the most recent Mortgage that was taken out on this home.
Original Mortgage
$203,278
Interest Rate
6.49%
Mortgage Type
VA
Purchase Details
Closed on
Mar 1, 2006
Sold by
Pack Kevin E and Pack Tracy L
Bought by
Higbee Paul D and Higbee Zenaida K
Home Financials for this Owner
Home Financials are based on the most recent Mortgage that was taken out on this home.
Original Mortgage
$33,800
Interest Rate
5.61%
Mortgage Type
Stand Alone Second
Purchase Details
Closed on
Oct 14, 1999
Sold by
Nilson & Company Inc
Bought by
Pack Kevin E and Pack Tracy L
Home Financials for this Owner
Home Financials are based on the most recent Mortgage that was taken out on this home.
Original Mortgage
$129,073
Interest Rate
7.77%
Mortgage Type
FHA
Create a Home Valuation Report for This Property
The Home Valuation Report is an in-depth analysis detailing your home's value as well as a comparison with similar homes in the area
Home Values in the Area
Average Home Value in this Area
Purchase History
We collect this data history from publicly available records. To have your information removed, we recommend requesting removal directly through your county’s website.
| Date | Buyer | Sale Price | Title Company |
|---|---|---|---|
| Dwf Vi Atlas Sfr Ut Llc | -- | None Listed On Document | |
| Property Seller Solutions Llc | -- | Gt Title Services | |
| Cook Lowell | -- | Hickman Land Title Co | |
| Cook Lowell | -- | First American Castlewood | |
| Higbee Paul D | -- | Backman Title Services Ltd | |
| Pack Kevin E | -- | Bonneville Title |
Source: Public Records
Mortgage History
We collect this data history from publicly available records. To have your information removed, we recommend requesting removal directly through your county’s website.
| Date | Status | Borrower | Loan Amount |
|---|---|---|---|
| Previous Owner | Property Seller Solutions Llc | $392,770 | |
| Previous Owner | Cook Lowell | $200,830 | |
| Previous Owner | Cook Lowell | $203,278 | |
| Previous Owner | Higbee Paul D | $33,800 | |
| Previous Owner | Higbee Paul D | $135,200 | |
| Previous Owner | Pack Kevin E | $129,073 |
Source: Public Records
Tax History
| Year | Tax Paid | Tax Assessment Tax Assessment Total Assessment is a certain percentage of the fair market value that is determined by local assessors to be the total taxable value of land and additions on the property. | Land | Improvement |
|---|---|---|---|---|
| 2025 | $2,746 | $436,520 | $134,119 | $302,401 |
| 2024 | $2,681 | $429,000 | $133,975 | $295,025 |
| 2023 | $2,723 | $439,000 | $133,975 | $305,025 |
| 2022 | $2,789 | $463,000 | $113,338 | $349,662 |
| 2021 | $2,210 | $330,000 | $87,470 | $242,530 |
| 2020 | $2,066 | $283,000 | $87,470 | $195,530 |
| 2019 | $623 | $255,000 | $51,947 | $203,053 |
| 2018 | $555 | $238,000 | $48,903 | $189,097 |
| 2017 | $364 | $206,000 | $47,839 | $158,161 |
| 2016 | $226 | $103,722 | $25,009 | $78,713 |
| 2015 | $188 | $95,182 | $22,284 | $72,898 |
| 2014 | $186 | $85,356 | $22,284 | $63,072 |
Source: Public Records
Map
Nearby Homes
- 5854 S 3500 W
- 5999 S 3200 W
- 2593 N 2000 W
- 5888 S 3650 W
- 5727 S 3550 W
- 2596 N 2125 W Unit 151
- 2596 N 2125 W
- 2582 N 2125 W
- 2186 W 2615 N Unit 139
- 2177 W 2615 N Unit 135
- 3176 W 5625 S
- 1387 W 2600 N
- 5566 S 3200 W
- 2994 W 5750 S
- 5483 S 3275 W
- 3016 W 5650 S
- 5867 S 2900 W
- 3184 W 5525 S
- 2896 W 6000 S
- 3830 W 5700 S
Your Personal Tour Guide
Ask me questions while you tour the home.