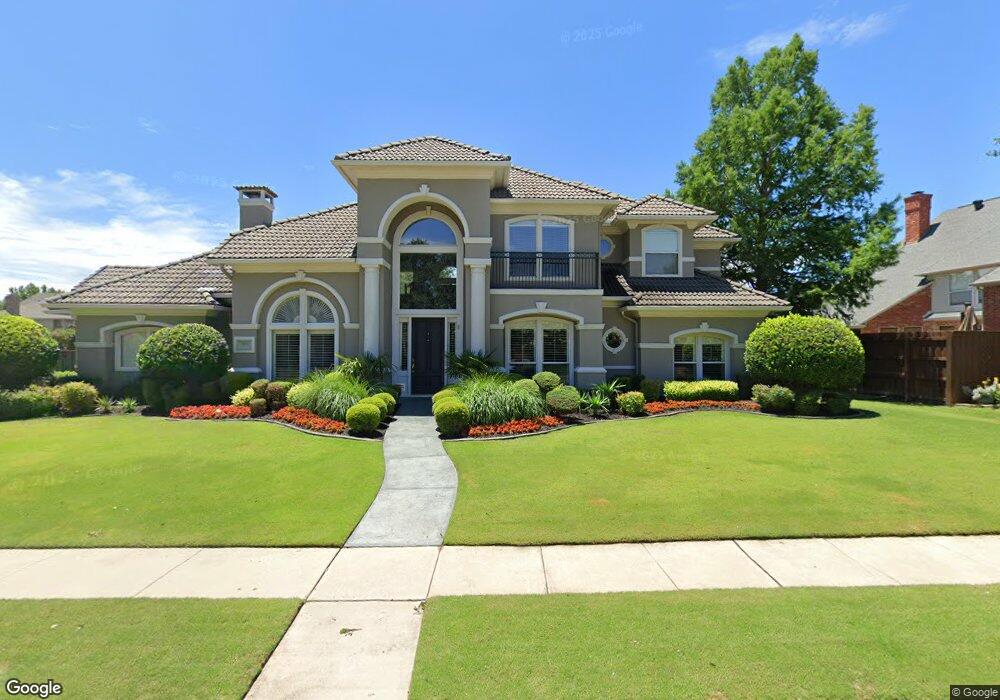
5956 Glendower Ln Plano, TX 75093
Willow Bend NeighborhoodEstimated Value: $1,151,369 - $1,286,000
4
Beds
5
Baths
3,971
Sq Ft
$304/Sq Ft
Est. Value
About This Home
This home is located at 5956 Glendower Ln, Plano, TX 75093 and is currently estimated at $1,205,342, approximately $303 per square foot. 5956 Glendower Ln is a home located in Collin County with nearby schools including Centennial Elementary School, Renner Middle School, and Plano West Senior High School.
Ownership History
Date
Name
Owned For
Owner Type
Purchase Details
Closed on
Apr 27, 2000
Sold by
Botkin Paul M and Botkin Mary D
Bought by
Fellwock Michael J and Fellwock Debra J
Current Estimated Value
Home Financials for this Owner
Home Financials are based on the most recent Mortgage that was taken out on this home.
Original Mortgage
$300,000
Outstanding Balance
$89,520
Interest Rate
6.25%
Estimated Equity
$1,115,822
Purchase Details
Closed on
Jun 10, 1996
Sold by
Hanover Homes Inc
Bought by
Botkin Paul M and Botkin Mary D
Home Financials for this Owner
Home Financials are based on the most recent Mortgage that was taken out on this home.
Original Mortgage
$315,000
Interest Rate
8.24%
Purchase Details
Closed on
Aug 10, 1995
Sold by
Hillwood/Willow Bend Ltd
Bought by
Hanover Homes Inc
Home Financials for this Owner
Home Financials are based on the most recent Mortgage that was taken out on this home.
Original Mortgage
$2,500,000
Interest Rate
7.59%
Mortgage Type
Construction
Create a Home Valuation Report for This Property
The Home Valuation Report is an in-depth analysis detailing your home's value as well as a comparison with similar homes in the area
Home Values in the Area
Average Home Value in this Area
Purchase History
| Date | Buyer | Sale Price | Title Company |
|---|---|---|---|
| Fellwock Michael J | -- | -- | |
| Botkin Paul M | -- | -- | |
| Hanover Homes Inc | -- | -- |
Source: Public Records
Mortgage History
| Date | Status | Borrower | Loan Amount |
|---|---|---|---|
| Open | Fellwock Michael J | $300,000 | |
| Previous Owner | Botkin Paul M | $315,000 | |
| Previous Owner | Hanover Homes Inc | $2,500,000 |
Source: Public Records
Tax History Compared to Growth
Tax History
| Year | Tax Paid | Tax Assessment Tax Assessment Total Assessment is a certain percentage of the fair market value that is determined by local assessors to be the total taxable value of land and additions on the property. | Land | Improvement |
|---|---|---|---|---|
| 2025 | $12,880 | $1,009,117 | $300,000 | $709,117 |
| 2024 | $12,880 | $1,004,517 | $250,000 | $769,725 |
| 2023 | $12,880 | $913,197 | $200,000 | $843,320 |
| 2022 | $15,865 | $830,179 | $200,000 | $694,081 |
| 2021 | $15,219 | $754,708 | $160,000 | $594,708 |
| 2020 | $14,087 | $689,948 | $160,000 | $529,948 |
| 2019 | $14,813 | $685,368 | $160,000 | $525,368 |
| 2018 | $14,388 | $660,124 | $160,000 | $500,124 |
| 2017 | $13,882 | $636,879 | $160,000 | $476,879 |
| 2016 | $13,587 | $615,587 | $160,000 | $455,587 |
| 2015 | $11,756 | $578,626 | $140,000 | $438,626 |
Source: Public Records
Map
Nearby Homes
- 5965 Glendower Ln
- 5920 Glendower Ln
- 5912 Broadmeade Dr
- 5928 Carnegie Ln
- 5820 Deer Park Ln
- 5925 Royal Palm Dr
- 5821 Braemar Dr
- 3216 Saint Bridges Dr
- 5948 King William Dr
- 3020 Shelton Way
- 2165 Fawnwood Dr
- 5909 Fossil Ridge Dr
- 5716 Northbrook Dr
- 3000 Vinson Ln
- 2109 Fawnwood Dr
- 2612 Barrington Dr
- 6229 Park Meadow Ln
- 6213 Warrington Dr
- 5904 Sandhills Cir
- 2901 Mill Haven Ct
- 5960 Glendower Ln
- 5961 Temple Dr
- 5948 Glendower Ln
- 5953 Glendower Ln
- 5957 Glendower Ln
- 5964 Glendower Ln
- 5953 Temple Dr
- 5965 Temple Dr
- 5961 Glendower Ln
- 5944 Glendower Ln
- 5945 Glendower Ln
- 5949 Temple Dr
- 5968 Glendower Ln
- 5969 Temple Dr
- 5952 Willowross Way
- 5956 Willowross Way
- 5945 Temple Dr
- 2624 Notre Dame Dr
- 5940 Glendower Ln
- 5941 Glendower Ln