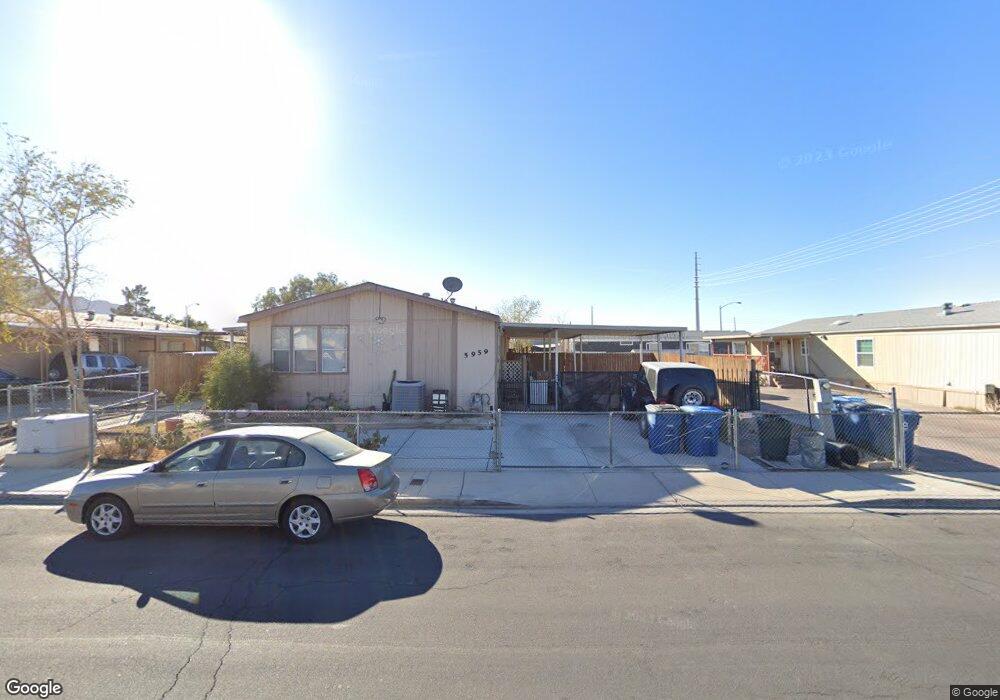
5959 Bluehill Ave Las Vegas, NV 89156
Estimated Value: $230,351 - $333,000
3
Beds
2
Baths
1,772
Sq Ft
$161/Sq Ft
Est. Value
About This Home
This home is located at 5959 Bluehill Ave, Las Vegas, NV 89156 and is currently estimated at $284,838, approximately $160 per square foot. 5959 Bluehill Ave is a home located in Clark County with nearby schools including Helen Herr Elementary School, Dr. William H. Bailey Middle School, and Sunrise Mountain High School.
Ownership History
Date
Name
Owned For
Owner Type
Purchase Details
Closed on
May 31, 2006
Sold by
Milbourn Dan and Milbourn Sylvia L
Bought by
Dapprich Tamela D and Dapprich Mary L
Current Estimated Value
Home Financials for this Owner
Home Financials are based on the most recent Mortgage that was taken out on this home.
Original Mortgage
$119,900
Outstanding Balance
$70,294
Interest Rate
6.52%
Mortgage Type
Fannie Mae Freddie Mac
Estimated Equity
$214,544
Purchase Details
Closed on
Sep 28, 2004
Sold by
Milbourn Sylvia L and Milbourn Sylvia L Wilson
Bought by
Milbourn Dan and Milbourn Sylvia L
Home Financials for this Owner
Home Financials are based on the most recent Mortgage that was taken out on this home.
Original Mortgage
$81,900
Interest Rate
6.62%
Mortgage Type
New Conventional
Purchase Details
Closed on
Oct 14, 1996
Sold by
Wilson Marion R
Bought by
Milbourn Sylvia L Wilson
Create a Home Valuation Report for This Property
The Home Valuation Report is an in-depth analysis detailing your home's value as well as a comparison with similar homes in the area
Home Values in the Area
Average Home Value in this Area
Purchase History
| Date | Buyer | Sale Price | Title Company |
|---|---|---|---|
| Dapprich Tamela D | $159,900 | Chicago Title | |
| Milbourn Dan | -- | Old Republic Title Co Of Nv | |
| Milbourn Sylvia L Wilson | -- | -- |
Source: Public Records
Mortgage History
| Date | Status | Borrower | Loan Amount |
|---|---|---|---|
| Open | Dapprich Tamela D | $119,900 | |
| Previous Owner | Milbourn Dan | $81,900 |
Source: Public Records
Tax History Compared to Growth
Tax History
| Year | Tax Paid | Tax Assessment Tax Assessment Total Assessment is a certain percentage of the fair market value that is determined by local assessors to be the total taxable value of land and additions on the property. | Land | Improvement |
|---|---|---|---|---|
| 2025 | $402 | $50,244 | $23,100 | $27,144 |
| 2024 | $390 | $50,244 | $23,100 | $27,144 |
| 2023 | $390 | $44,718 | $19,250 | $25,468 |
| 2022 | $379 | $39,087 | $15,400 | $23,687 |
| 2021 | $368 | $36,304 | $13,650 | $22,654 |
| 2020 | $354 | $34,603 | $12,250 | $22,353 |
| 2019 | $344 | $31,961 | $9,800 | $22,161 |
| 2018 | $338 | $28,097 | $6,650 | $21,447 |
| 2017 | $775 | $26,433 | $6,650 | $19,783 |
| 2016 | $318 | $28,634 | $6,300 | $22,334 |
| 2015 | $316 | $27,859 | $5,250 | $22,609 |
| 2014 | $307 | $10,919 | $5,250 | $5,669 |
Source: Public Records
Map
Nearby Homes
- 5988 Castlemont Ave
- 5987 Stone Hollow Ave
- 6012 Riflecrest Ave
- 5988 Turtle River Ave
- 5994 Rocky Mountain Ave
- 6132 Stone Hollow Ave
- 5822 E Carey Ave
- 2776 Jupiter Creek St
- 2357 Flaming Gorge St
- 2775 Herron Hills St
- 2724 Echo Springs St
- 6071 Big Bend Ave
- 2764 Echo Springs St
- 2273 Toiyabe St
- 2257 Toiyabe St
- 6266 Bluehurst Ave
- 2242 Toiyabe St
- 2248 Jo Anne Ln
- 6061 Judson Ave
- 5606 E Carey Ave
- 5965 Bluehill Ave
- 5955 Bluehill Ave
- 2562 Toiyabe St
- 5975 Bluehill Ave
- 2561 Edgemere Way
- 2552 Toiyabe St
- 5964 Bluehill Ave
- 5954 Bluehill Ave
- 5985 Bluehill Ave
- 5974 Bluehill Ave
- 2542 Toiyabe St
- 2551 Edgemere Way
- 5984 Bluehill Ave
- 5995 Bluehill Ave
- 5927 Stone Hollow Ave
- 5998 Castlemont Ave
- 5943 Stone Hollow Ave
- 5951 Stone Hollow Ave
- 2536 Toiyabe St