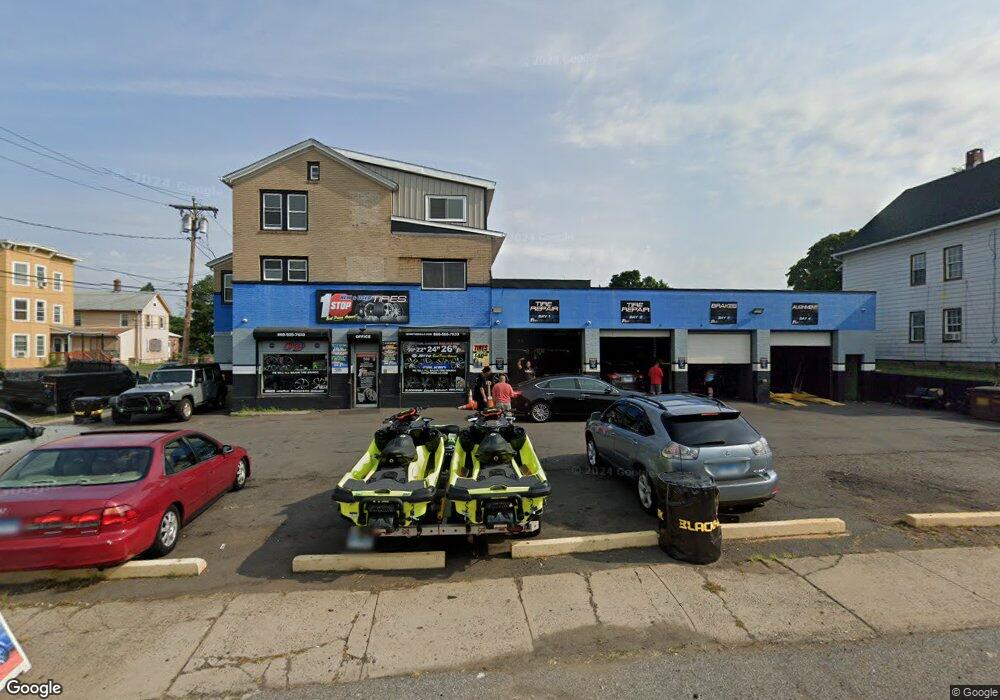
596 E Main St New Britain, CT 06051
Estimated Value: $334,416
5
Beds
2
Baths
5,622
Sq Ft
$59/Sq Ft
Est. Value
About This Home
This home is located at 596 E Main St, New Britain, CT 06051 and is currently estimated at $334,416, approximately $59 per square foot. 596 E Main St is a home located in Hartford County with nearby schools including Chamberlain School, Pulaski Middle School, and Emmanuel Christian Academy.
Ownership History
Date
Name
Owned For
Owner Type
Purchase Details
Closed on
May 7, 2018
Sold by
East Main Property Mgm
Bought by
Brito Realty Llc
Current Estimated Value
Home Financials for this Owner
Home Financials are based on the most recent Mortgage that was taken out on this home.
Original Mortgage
$146,433
Outstanding Balance
$126,229
Interest Rate
4.45%
Mortgage Type
Commercial
Estimated Equity
$208,187
Purchase Details
Closed on
May 15, 2014
Sold by
Desade Malik
Bought by
East Main Property Mgm
Purchase Details
Closed on
Feb 16, 2012
Sold by
East Main Props Mgt Ll
Bought by
Desade Malik
Home Financials for this Owner
Home Financials are based on the most recent Mortgage that was taken out on this home.
Original Mortgage
$150,000
Interest Rate
3.93%
Mortgage Type
Commercial
Purchase Details
Closed on
May 20, 2008
Sold by
Linali Llc
Bought by
East Main Prop Mgmt Ll
Purchase Details
Closed on
Apr 15, 2003
Sold by
Petow Dean A and Reeve Judith
Bought by
Le Z Llc
Create a Home Valuation Report for This Property
The Home Valuation Report is an in-depth analysis detailing your home's value as well as a comparison with similar homes in the area
Home Values in the Area
Average Home Value in this Area
Purchase History
| Date | Buyer | Sale Price | Title Company |
|---|---|---|---|
| Brito Realty Llc | $185,000 | -- | |
| East Main Property Mgm | -- | -- | |
| Desade Malik | $150,000 | -- | |
| East Main Prop Mgmt Ll | $237,250 | -- | |
| Le Z Llc | $125,000 | -- |
Source: Public Records
Mortgage History
| Date | Status | Borrower | Loan Amount |
|---|---|---|---|
| Open | Brito Realty Llc | $146,433 | |
| Previous Owner | Le Z Llc | $150,000 | |
| Previous Owner | Le Z Llc | $205,000 | |
| Previous Owner | Le Z Llc | $27,000 |
Source: Public Records
Tax History
| Year | Tax Paid | Tax Assessment Tax Assessment Total Assessment is a certain percentage of the fair market value that is determined by local assessors to be the total taxable value of land and additions on the property. | Land | Improvement |
|---|---|---|---|---|
| 2025 | $8,957 | $228,620 | $33,180 | $195,440 |
| 2024 | $6,903 | $174,370 | $33,180 | $141,190 |
| 2023 | $6,675 | $174,370 | $33,180 | $141,190 |
| 2022 | $5,575 | $112,630 | $29,120 | $83,510 |
| 2021 | $5,575 | $112,630 | $29,120 | $83,510 |
| 2020 | $5,688 | $112,630 | $29,120 | $83,510 |
| 2019 | $5,688 | $112,630 | $29,120 | $83,510 |
| 2018 | $5,688 | $112,630 | $29,120 | $83,510 |
| 2017 | $5,083 | $100,660 | $27,720 | $72,940 |
| 2016 | $5,083 | $100,660 | $27,720 | $72,940 |
| 2015 | $4,932 | $100,660 | $27,720 | $72,940 |
| 2014 | $4,932 | $100,660 | $27,720 | $72,940 |
Source: Public Records
Map
Nearby Homes
- 42 Connerton St
- 59 Smalley St
- 11 Dwight Ct
- 221 Fairview St
- 484 Church St
- 561 East St
- 547 East St
- 351 Chestnut St
- 835 East St Unit 837
- 73 Linden St
- 108 Belden St
- 159 Rhodes St
- 104A Chapman St
- 151 Newington Ave Unit 3A(5)
- 192 Market St
- 15 Tremont St
- 116 Sunrise Ave
- 50 Long St Unit 5
- 76 West St
- 123 North St
- 606 E Main St
- 608 E Main St
- 21 Olive St
- 14 Olive St
- 23 Olive St
- 612 E Main St
- 605 E Main St
- 20 Olive St
- 29 Olive St Unit 3
- 24 Dewey St
- 26 Dewey St
- 35 Olive St
- 45 Connerton St
- 45 Connerton St Unit 2nd Fl
- 45 Connerton St Unit 1 North
- 41 Connerton St
- 619 E Main St
- 34 Dewey St
- 35 Connerton St
- 36 Olive St Unit 38
Your Personal Tour Guide
Ask me questions while you tour the home.