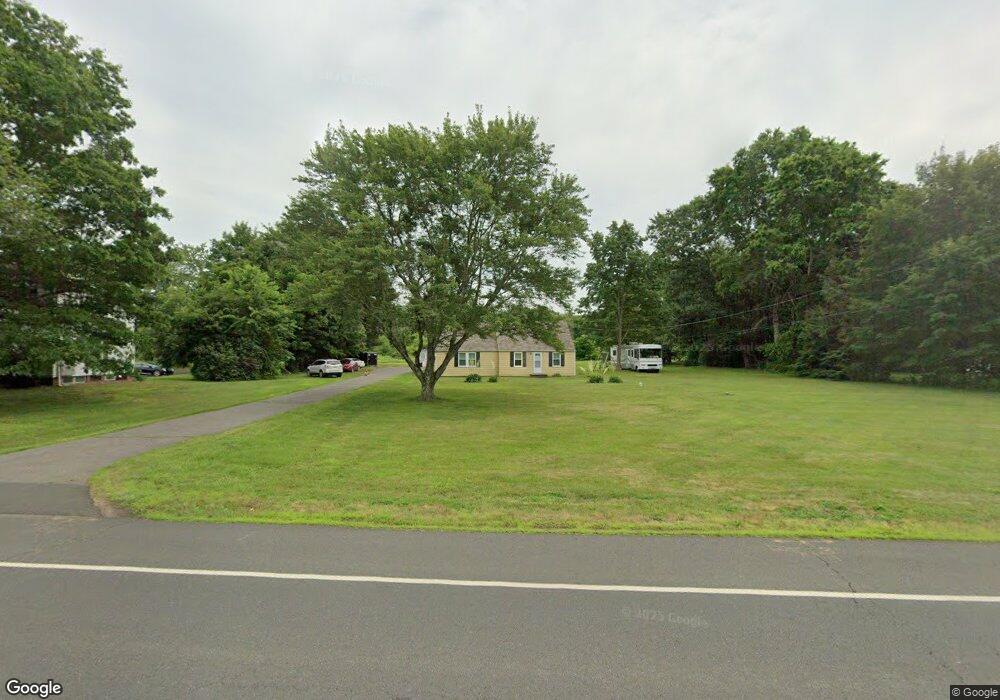
596 East St S Suffield, CT 06078
Estimated Value: $368,714 - $459,000
4
Beds
2
Baths
1,976
Sq Ft
$210/Sq Ft
Est. Value
About This Home
This home is located at 596 East St S, Suffield, CT 06078 and is currently estimated at $415,429, approximately $210 per square foot. 596 East St S is a home located in Hartford County with nearby schools including A. Ward Spaulding School, Mcalister Intermediate School, and Suffield Middle School.
Ownership History
Date
Name
Owned For
Owner Type
Purchase Details
Closed on
Feb 15, 2021
Sold by
Pease Ronald F
Bought by
Pease Ronald F and Pease Shannon M
Current Estimated Value
Home Financials for this Owner
Home Financials are based on the most recent Mortgage that was taken out on this home.
Original Mortgage
$222,000
Interest Rate
2.2%
Mortgage Type
Stand Alone Refi Refinance Of Original Loan
Purchase Details
Closed on
Mar 18, 2003
Sold by
Dillow James and Dillow Sylvia
Bought by
Pease Ronald
Home Financials for this Owner
Home Financials are based on the most recent Mortgage that was taken out on this home.
Original Mortgage
$172,448
Interest Rate
5.94%
Create a Home Valuation Report for This Property
The Home Valuation Report is an in-depth analysis detailing your home's value as well as a comparison with similar homes in the area
Home Values in the Area
Average Home Value in this Area
Purchase History
| Date | Buyer | Sale Price | Title Company |
|---|---|---|---|
| Pease Ronald F | -- | None Available | |
| Pease Ronald F | -- | None Available | |
| Pease Ronald | $179,900 | -- | |
| Pease Ronald | $179,900 | -- |
Source: Public Records
Mortgage History
| Date | Status | Borrower | Loan Amount |
|---|---|---|---|
| Previous Owner | Pease Ronald F | $222,000 | |
| Previous Owner | Pease Ronald | $201,750 | |
| Previous Owner | Pease Ronald | $172,448 | |
| Previous Owner | Pease Ronald | $62,000 |
Source: Public Records
Tax History
| Year | Tax Paid | Tax Assessment Tax Assessment Total Assessment is a certain percentage of the fair market value that is determined by local assessors to be the total taxable value of land and additions on the property. | Land | Improvement |
|---|---|---|---|---|
| 2025 | $4,762 | $203,420 | $59,220 | $144,200 |
| 2024 | $4,603 | $203,420 | $59,220 | $144,200 |
| 2023 | $4,422 | $154,560 | $59,360 | $95,200 |
| 2022 | $4,422 | $154,560 | $59,360 | $95,200 |
| 2021 | $4,427 | $154,560 | $59,360 | $95,200 |
| 2020 | $4,427 | $154,560 | $59,360 | $95,200 |
| 2019 | $4,439 | $154,560 | $59,360 | $95,200 |
| 2018 | $4,226 | $144,130 | $56,840 | $87,290 |
| 2017 | $4,164 | $144,130 | $56,840 | $87,290 |
| 2016 | $4,064 | $144,130 | $56,840 | $87,290 |
| 2015 | $4,004 | $144,130 | $56,840 | $87,290 |
| 2014 | $3,909 | $144,130 | $56,840 | $87,290 |
Source: Public Records
Map
Nearby Homes
- 660 East St S
- 315 East St S
- 9 Green Briar Dr Unit 9
- 5 the Hamlet Unit D
- 779 Bridge St
- 2 Pearl Street Extension
- 1561 King St
- 1527 King St
- 713 Thrall Ave
- 424 Bridge St
- 1453 Suffield St
- 22 Pearl St
- 0 Mullen Rd
- 1.5 Bridge Ln
- 22 Pheasant Hill Dr
- 20 Pleasant St Unit 22
- 813 Overhill Dr
- 42 Chapman Chase Unit 42
- 32 Pleasant Rd
- 15 Suffield St
Your Personal Tour Guide
Ask me questions while you tour the home.