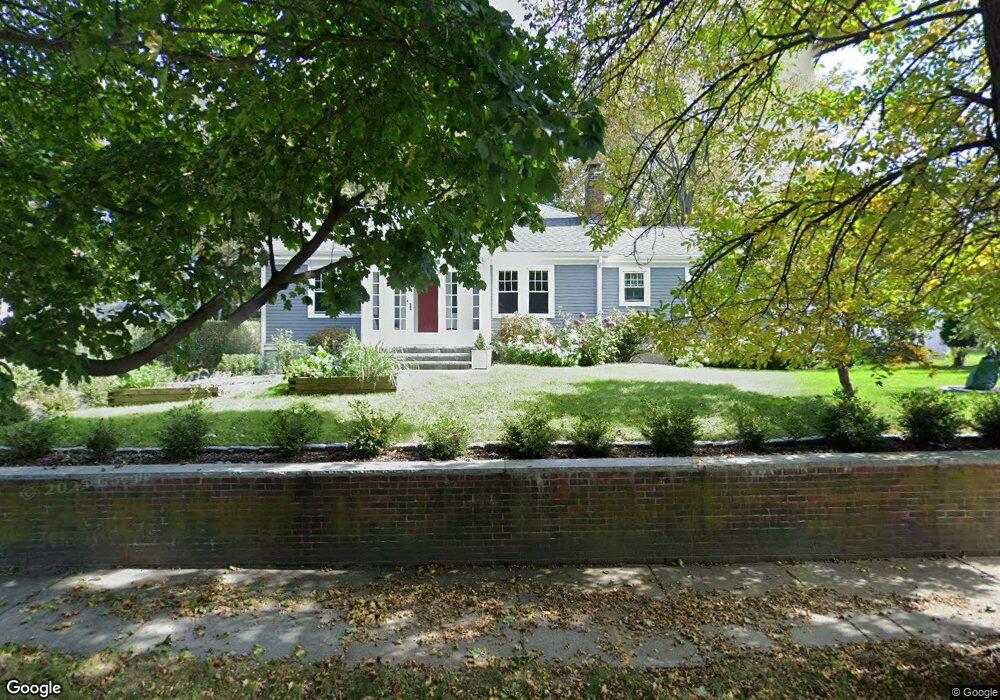
596 Grove St Newton Lower Falls, MA 02462
Newton Lower Falls NeighborhoodEstimated Value: $1,246,000 - $1,332,294
3
Beds
2
Baths
1,766
Sq Ft
$729/Sq Ft
Est. Value
About This Home
This home is located at 596 Grove St, Newton Lower Falls, MA 02462 and is currently estimated at $1,286,824, approximately $728 per square foot. 596 Grove St is a home located in Middlesex County with nearby schools including Angier Elementary School, Charles E Brown Middle School, and Newton South High School.
Ownership History
Date
Name
Owned For
Owner Type
Purchase Details
Closed on
Jul 31, 2009
Sold by
Jones Margaret
Bought by
Sutherland-Smith James and Abell Katrina
Current Estimated Value
Home Financials for this Owner
Home Financials are based on the most recent Mortgage that was taken out on this home.
Original Mortgage
$529,100
Outstanding Balance
$348,827
Interest Rate
5.43%
Mortgage Type
Purchase Money Mortgage
Estimated Equity
$937,997
Create a Home Valuation Report for This Property
The Home Valuation Report is an in-depth analysis detailing your home's value as well as a comparison with similar homes in the area
Home Values in the Area
Average Home Value in this Area
Purchase History
| Date | Buyer | Sale Price | Title Company |
|---|---|---|---|
| Sutherland-Smith James | $550,900 | -- |
Source: Public Records
Mortgage History
| Date | Status | Borrower | Loan Amount |
|---|---|---|---|
| Open | Sutherland-Smith James | $529,100 |
Source: Public Records
Tax History
| Year | Tax Paid | Tax Assessment Tax Assessment Total Assessment is a certain percentage of the fair market value that is determined by local assessors to be the total taxable value of land and additions on the property. | Land | Improvement |
|---|---|---|---|---|
| 2025 | $9,784 | $998,400 | $780,000 | $218,400 |
| 2024 | $9,460 | $969,300 | $757,300 | $212,000 |
| 2023 | $8,910 | $875,200 | $586,500 | $288,700 |
| 2022 | $8,460 | $804,200 | $543,100 | $261,100 |
| 2021 | $8,164 | $758,700 | $512,400 | $246,300 |
| 2020 | $7,921 | $758,700 | $512,400 | $246,300 |
| 2019 | $7,697 | $736,600 | $497,500 | $239,100 |
| 2018 | $7,276 | $672,500 | $445,600 | $226,900 |
| 2017 | $7,055 | $634,400 | $420,400 | $214,000 |
| 2016 | $6,537 | $574,400 | $392,900 | $181,500 |
| 2015 | $6,232 | $536,800 | $367,200 | $169,600 |
Source: Public Records
Map
Nearby Homes
Your Personal Tour Guide
Ask me questions while you tour the home.