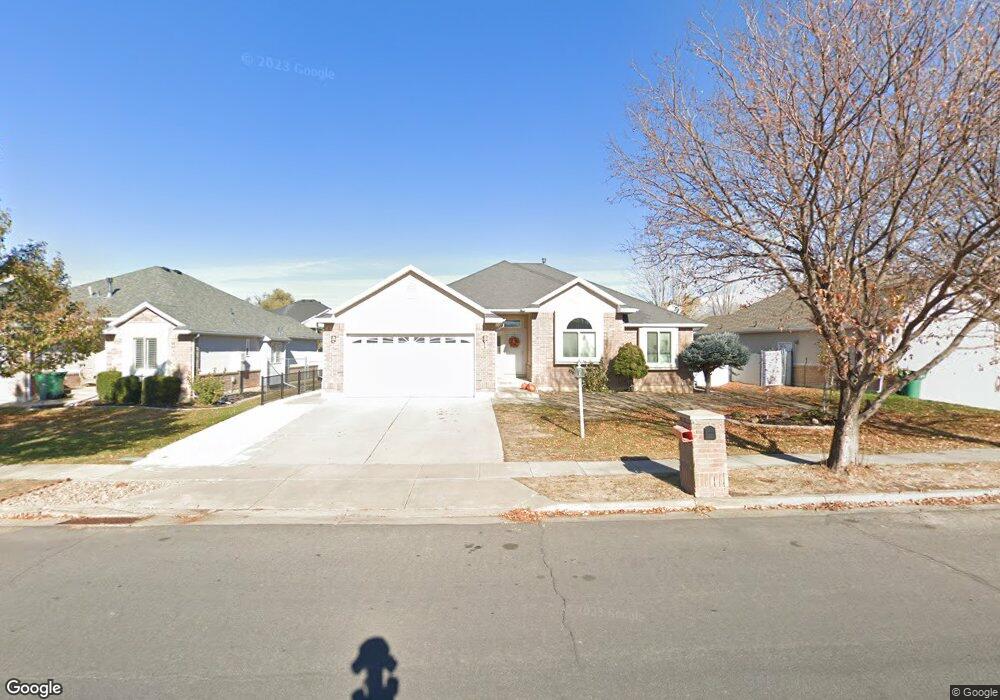
596 W 2275 N Layton, UT 84041
Estimated Value: $571,000 - $629,000
--
Bed
3
Baths
1,566
Sq Ft
$377/Sq Ft
Est. Value
About This Home
This home is located at 596 W 2275 N, Layton, UT 84041 and is currently estimated at $589,694, approximately $376 per square foot. 596 W 2275 N is a home located in Davis County with nearby schools including Lincoln Elementary School, North Layton Junior High School, and Northridge High School.
Ownership History
Date
Name
Owned For
Owner Type
Purchase Details
Closed on
Jan 2, 2024
Sold by
Kumar Tamara and Kumar Randhir
Bought by
Hoffenreich Enterprises Llc
Current Estimated Value
Purchase Details
Closed on
Oct 28, 2021
Sold by
Li Wei Yan
Bought by
Kumar Tamara and Kumar Randhir
Home Financials for this Owner
Home Financials are based on the most recent Mortgage that was taken out on this home.
Original Mortgage
$450,000
Interest Rate
2.8%
Mortgage Type
New Conventional
Purchase Details
Closed on
Dec 5, 2011
Sold by
Bambrough Margene and Izatt Mary Ellen
Bought by
Li Wei Yan
Home Financials for this Owner
Home Financials are based on the most recent Mortgage that was taken out on this home.
Original Mortgage
$179,275
Interest Rate
3.87%
Mortgage Type
FHA
Purchase Details
Closed on
Sep 18, 1996
Sold by
Willow Bend Inc
Bought by
Adams Darold and Adams Marguerite B
Create a Home Valuation Report for This Property
The Home Valuation Report is an in-depth analysis detailing your home's value as well as a comparison with similar homes in the area
Home Values in the Area
Average Home Value in this Area
Purchase History
| Date | Buyer | Sale Price | Title Company |
|---|---|---|---|
| Hoffenreich Enterprises Llc | -- | None Listed On Document | |
| Kumar Tamara | -- | Title One Inc | |
| Li Wei Yan | -- | Security Title Of Davis Cnty | |
| Adams Darold | -- | Mountain View Title |
Source: Public Records
Mortgage History
| Date | Status | Borrower | Loan Amount |
|---|---|---|---|
| Previous Owner | Kumar Tamara | $450,000 | |
| Previous Owner | Li Wei Yan | $179,275 |
Source: Public Records
Tax History
| Year | Tax Paid | Tax Assessment Tax Assessment Total Assessment is a certain percentage of the fair market value that is determined by local assessors to be the total taxable value of land and additions on the property. | Land | Improvement |
|---|---|---|---|---|
| 2025 | $2,667 | $279,950 | $101,220 | $178,730 |
| 2024 | $2,559 | $270,599 | $117,988 | $152,611 |
| 2023 | $2,667 | $497,000 | $140,713 | $356,287 |
| 2022 | $2,739 | $277,200 | $74,266 | $202,934 |
| 2021 | $2,517 | $380,000 | $103,826 | $276,174 |
| 2020 | $2,293 | $332,000 | $87,509 | $244,491 |
| 2019 | $2,207 | $313,000 | $83,247 | $229,753 |
| 2018 | $2,030 | $289,000 | $83,247 | $205,753 |
| 2016 | $1,948 | $143,110 | $26,501 | $116,609 |
| 2015 | $1,871 | $130,460 | $26,501 | $103,959 |
| 2014 | $1,843 | $131,433 | $26,501 | $104,932 |
| 2013 | -- | $131,537 | $26,884 | $104,653 |
Source: Public Records
Map
Nearby Homes
- 2236 N 525 W
- 506 W 2200 N
- 498 W 2200 N
- 2246 N 475 W
- 2214 N 450 W
- 2386 N 800 W
- 820 W 2350 N
- 1012 W 2525 N
- 2320 N 1085 W
- 2600 N Hill Field Rd Unit 134
- 2600 N Hill Field Rd Unit 4
- 2600 N Hill Field Rd Unit 71
- 2875 N Hill Field Rd Unit 17
- 2875 N Hill Field Rd Unit 199
- 2875 N Hill Field Rd Unit 29
- 262 W 1850 N
- 2500 N Fort Ln Unit 212
- 2500 N Fort Ln Unit 244
- 621 Paul Ave
- 1908 N 200 W
Your Personal Tour Guide
Ask me questions while you tour the home.