596 W 450 N Clearfield, UT 84015
Estimated Value: $437,000 - $476,000
3
Beds
2
Baths
2,500
Sq Ft
$182/Sq Ft
Est. Value
About This Home
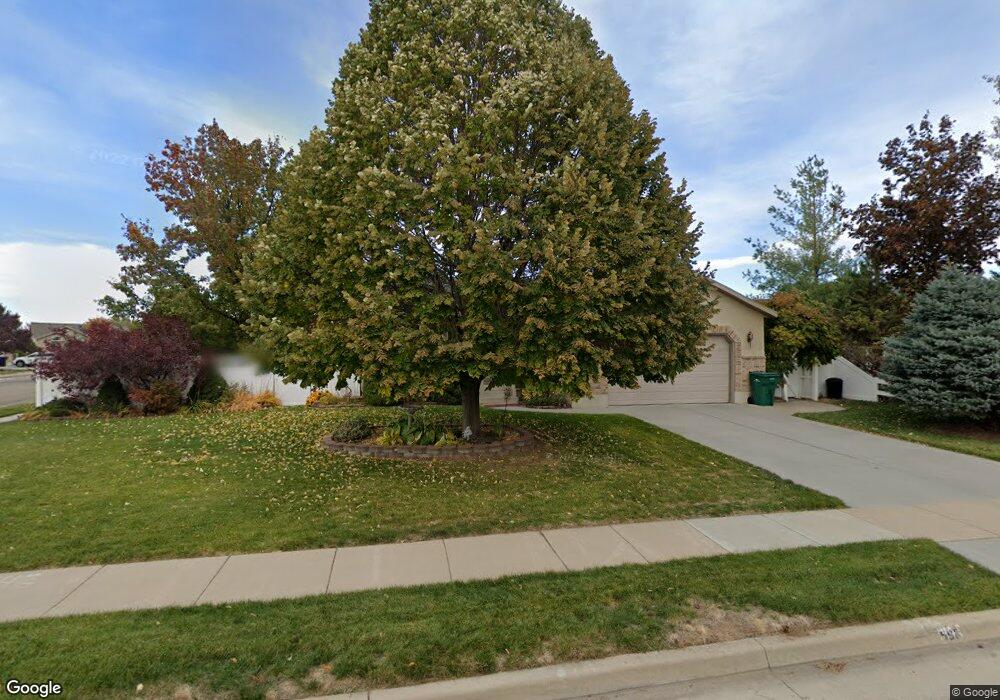
This home is located at 596 W 450 N, Clearfield, UT 84015 and is currently estimated at $454,780, approximately $181 per square foot. 596 W 450 N is a home located in Davis County with nearby schools including Holt Elementary School, North Davis Junior High School, and Clearfield High School.
Ownership History
Date
Name
Owned For
Owner Type
Purchase Details
Closed on
Oct 4, 2018
Sold by
Ostler Mary J O
Bought by
Ostler Mary Jo and Mary Jo Ostler Family Living Trust
Current Estimated Value
Purchase Details
Closed on
Dec 16, 2004
Sold by
Mike Schultz Construction Inc
Bought by
Ostler Barnell and Ostler Mary Jo
Purchase Details
Closed on
Nov 14, 2003
Sold by
Wentworth Development Llc
Bought by
Mike Schultz Construction Inc
Create a Home Valuation Report for This Property
The Home Valuation Report is an in-depth analysis detailing your home's value as well as a comparison with similar homes in the area
Home Values in the Area
Average Home Value in this Area
Purchase History
| Date | Buyer | Sale Price | Title Company |
|---|---|---|---|
| Ostler Mary Jo | -- | None Available | |
| Ostler Barnell | -- | Heritage West Title Ins Agen | |
| Mike Schultz Construction Inc | -- | Integrated Title Insurance S |
Source: Public Records
Tax History Compared to Growth
Tax History
| Year | Tax Paid | Tax Assessment Tax Assessment Total Assessment is a certain percentage of the fair market value that is determined by local assessors to be the total taxable value of land and additions on the property. | Land | Improvement |
|---|---|---|---|---|
| 2025 | $356 | $235,950 | $72,833 | $163,117 |
| 2024 | $281 | $228,800 | $69,600 | $159,200 |
| 2023 | $2,481 | $411,000 | $110,958 | $300,042 |
| 2022 | $2,700 | $242,000 | $63,143 | $178,857 |
| 2021 | $532 | $334,000 | $69,276 | $264,724 |
| 2020 | $2,149 | $289,000 | $58,665 | $230,335 |
| 2019 | $2,087 | $277,000 | $60,001 | $216,999 |
| 2018 | $1,902 | $246,000 | $53,257 | $192,743 |
| 2016 | $145 | $109,011 | $32,770 | $76,241 |
| 2015 | $1,631 | $105,161 | $32,770 | $72,391 |
| 2014 | $327 | $103,051 | $32,770 | $70,281 |
| 2013 | -- | $87,018 | $31,185 | $55,833 |
Source: Public Records
Map
Nearby Homes