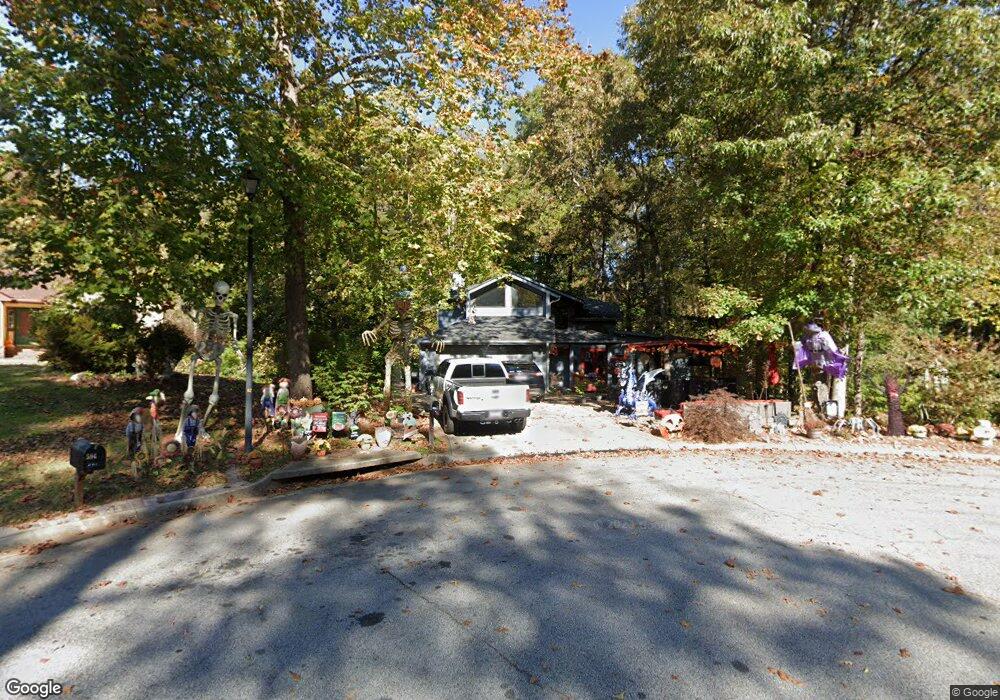
596 Willowgreen Ct SE Unit 3 Conyers, GA 30094
Estimated Value: $278,308 - $341,000
3
Beds
3
Baths
1,664
Sq Ft
$180/Sq Ft
Est. Value
About This Home
This home is located at 596 Willowgreen Ct SE Unit 3, Conyers, GA 30094 and is currently estimated at $299,327, approximately $179 per square foot. 596 Willowgreen Ct SE Unit 3 is a home located in Rockdale County with nearby schools including Barksdale Elementary School, Gen. Ray Davis Middle School, and Salem High School.
Ownership History
Date
Name
Owned For
Owner Type
Purchase Details
Closed on
Apr 24, 2017
Sold by
Holbrook Roger G
Bought by
Holbrook Roger G and Holbrook Katherine J
Current Estimated Value
Home Financials for this Owner
Home Financials are based on the most recent Mortgage that was taken out on this home.
Original Mortgage
$127,000
Outstanding Balance
$63,837
Interest Rate
3.44%
Mortgage Type
New Conventional
Estimated Equity
$235,490
Purchase Details
Closed on
Feb 26, 1999
Sold by
Thomas Damon F and Thomas Farah M
Bought by
Holbrook Roger G
Home Financials for this Owner
Home Financials are based on the most recent Mortgage that was taken out on this home.
Original Mortgage
$124,969
Interest Rate
6.82%
Mortgage Type
FHA
Purchase Details
Closed on
Jan 17, 1997
Sold by
Egan Janet Louise
Bought by
Thomas Damon Farah
Create a Home Valuation Report for This Property
The Home Valuation Report is an in-depth analysis detailing your home's value as well as a comparison with similar homes in the area
Home Values in the Area
Average Home Value in this Area
Purchase History
| Date | Buyer | Sale Price | Title Company |
|---|---|---|---|
| Holbrook Roger G | -- | -- | |
| Holbrook Roger G | $126,000 | -- | |
| Thomas Damon Farah | $119,900 | -- |
Source: Public Records
Mortgage History
| Date | Status | Borrower | Loan Amount |
|---|---|---|---|
| Open | Holbrook Roger G | $127,000 | |
| Previous Owner | Holbrook Roger G | $124,969 | |
| Closed | Thomas Damon Farah | $0 |
Source: Public Records
Tax History Compared to Growth
Tax History
| Year | Tax Paid | Tax Assessment Tax Assessment Total Assessment is a certain percentage of the fair market value that is determined by local assessors to be the total taxable value of land and additions on the property. | Land | Improvement |
|---|---|---|---|---|
| 2024 | $2,919 | $119,880 | $25,360 | $94,520 |
| 2023 | $2,657 | $113,400 | $26,400 | $87,000 |
| 2022 | $2,220 | $96,360 | $22,640 | $73,720 |
| 2021 | $2,020 | $83,560 | $17,040 | $66,520 |
| 2020 | $1,804 | $74,560 | $13,560 | $61,000 |
| 2019 | $1,453 | $61,680 | $10,840 | $50,840 |
| 2018 | $1,308 | $56,680 | $9,680 | $47,000 |
| 2017 | $949 | $44,680 | $8,680 | $36,000 |
| 2016 | $877 | $44,680 | $8,680 | $36,000 |
| 2015 | $879 | $44,680 | $8,680 | $36,000 |
| 2014 | $771 | $44,000 | $8,000 | $36,000 |
| 2013 | -- | $54,040 | $12,000 | $42,040 |
Source: Public Records
Map
Nearby Homes
- 2178 NE Hillwood Dr
- 5312 Ashley Dr SE
- 634 Knollwood Cir SE
- 4980 W Lake Dr SE
- 4931 W Lake Dr SE
- 4731 Shadybrook Way SE Unit 2
- 4938 Lake Forest Dr SE
- 1459 Highway 212 SW
- 4811 W Lake Dr SE
- 801 Greenwood Trail SE
- 134 Oak Hill West Rd
- 339 Buckingham Dr SW
- 821 Greenwood Trail SE
- 4970 Hull Rd SE
- 5170 Paul Cir SW
- 120 Wintergreen Ct
- 5190 Paul Cir SW
- 35 Fourwood Dr
- 307 Winding Stream Trail SW
- 4797 Hemlock Dr SE
- 594 Willowgreen Ct SE Unit 3
- 604 Willowgreen Ct SE
- 597 Willowgreen Ct SE
- 5181 Parkside Dr SE
- 581 Tahoe Dr SE
- 581 Tahoe Dr SE
- 614 Willowgreen Ct SE
- 605 Willowgreen Ct SE
- 0 Willowgreen Ct SE
- 5153 Parkside Dr SE
- 0 Parkside Dr SE Unit 7287236
- 0 Parkside Dr SE Unit 7266702
- 0 Parkside Dr SE Unit 8865649
- 0 Parkside Dr SE Unit 3200261
- 0 Parkside Dr SE Unit 8160674
- 0 Parkside Dr SE Unit 3097406
- 1253 Highway 212 SW
- 1239 Highway 212 SW
- 5219 Parkside Dr SE
- 1253 Georgia 212