5961 N Falls Cir Dr Unit 208 Lauderhill, FL 33319
Inverrary NeighborhoodEstimated Value: $174,325 - $207,000
2
Beds
2
Baths
1,360
Sq Ft
$145/Sq Ft
Est. Value
About This Home
This home is located at 5961 N Falls Cir Dr Unit 208, Lauderhill, FL 33319 and is currently estimated at $196,581, approximately $144 per square foot. 5961 N Falls Cir Dr Unit 208 is a home located in Broward County with nearby schools including Park Lakes Elementary School, Lauderdale Lakes Middle School, and Piper High School.
Ownership History
Date
Name
Owned For
Owner Type
Purchase Details
Closed on
Mar 31, 2023
Sold by
Hemmings Michelle
Bought by
Tirailleur Kerson and Bastien Cathiana
Current Estimated Value
Home Financials for this Owner
Home Financials are based on the most recent Mortgage that was taken out on this home.
Original Mortgage
$170,100
Outstanding Balance
$165,285
Interest Rate
6.5%
Mortgage Type
New Conventional
Estimated Equity
$31,296
Purchase Details
Closed on
Mar 31, 2017
Sold by
Avila Arias Javier
Bought by
Hemmings Michelle
Home Financials for this Owner
Home Financials are based on the most recent Mortgage that was taken out on this home.
Original Mortgage
$67,031
Interest Rate
4.16%
Mortgage Type
Balloon
Purchase Details
Closed on
Feb 18, 2000
Sold by
Betty L Tr And Julian S Glazer
Bought by
Arias Javier A
Purchase Details
Closed on
Nov 1, 1986
Create a Home Valuation Report for This Property
The Home Valuation Report is an in-depth analysis detailing your home's value as well as a comparison with similar homes in the area
Home Values in the Area
Average Home Value in this Area
Purchase History
| Date | Buyer | Sale Price | Title Company |
|---|---|---|---|
| Tirailleur Kerson | $189,000 | Priority Title | |
| Hemmings Michelle | $103,000 | Attorney Title Partners Inc | |
| Arias Javier A | $64,000 | -- | |
| -- | $6,428 | -- |
Source: Public Records
Mortgage History
| Date | Status | Borrower | Loan Amount |
|---|---|---|---|
| Open | Tirailleur Kerson | $170,100 | |
| Previous Owner | Hemmings Michelle | $67,031 | |
| Closed | Tirailleur Kerson | $10,000 |
Source: Public Records
Tax History Compared to Growth
Tax History
| Year | Tax Paid | Tax Assessment Tax Assessment Total Assessment is a certain percentage of the fair market value that is determined by local assessors to be the total taxable value of land and additions on the property. | Land | Improvement |
|---|---|---|---|---|
| 2025 | $4,862 | $180,030 | $18,000 | $162,030 |
| 2024 | $4,042 | $180,030 | $18,000 | $162,030 |
| 2023 | $4,042 | $135,780 | $0 | $0 |
| 2022 | $3,531 | $123,440 | $0 | $0 |
| 2021 | $3,286 | $112,220 | $0 | $0 |
| 2020 | $3,108 | $115,060 | $11,510 | $103,550 |
| 2019 | $2,854 | $98,620 | $9,860 | $88,760 |
| 2018 | $2,504 | $84,320 | $8,430 | $75,890 |
| 2017 | $2,087 | $65,820 | $0 | $0 |
| 2016 | $1,838 | $59,840 | $0 | $0 |
| 2015 | $1,825 | $54,450 | $0 | $0 |
| 2014 | $1,612 | $49,500 | $0 | $0 |
| 2013 | -- | $45,000 | $4,500 | $40,500 |
Source: Public Records
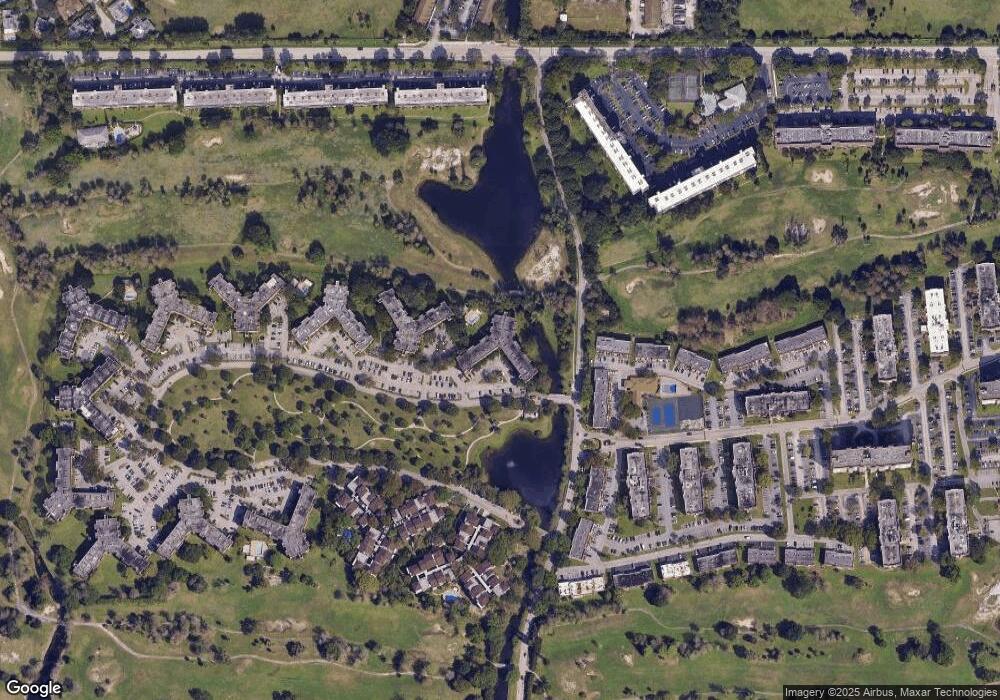
Map
Nearby Homes
- 5961 N Falls Cir Dr Unit 306
- 5961 N Falls Cir Dr Unit 408
- 6001 N Falls Circle Dr Unit 309
- 6001 N Falls Circle Dr Unit 1079
- 6001 N Falls Circle Dr Unit 4069
- 4088 Inverrary Dr Unit 11F
- 6061 N Falls Circle Dr Unit 407
- 6061 N Falls Circle Dr Unit 102
- 6061 N Falls Circle Dr Unit 110
- 6061 N Falls Circle Dr Unit 107
- 6061 N Falls Circle Dr Unit 302
- 6061 N Falls Circle Dr Unit 109
- 4026 Inverrary Dr Unit 8A
- 5860 NW 44th St Unit 314
- 5860 NW 44th St Unit 706
- 5860 NW 44th St Unit 509
- 5860 NW 44th St Unit 603
- 5860 NW 44th St Unit 214
- 5860 NW 44th St Unit 804
- 5860 NW 44th St Unit 412
- 5961 N Falls Cir Dr Unit 409
- 5961 N Falls Cir Dr Unit 307
- 5961 N Falls Circle Dr
- 5961 N Falls Cir Dr Unit 211
- 5961 N Falls Cir Dr Unit 412
- 5961 N Falls Cir Dr Unit 109
- 5961 N Falls Cir Dr Unit 101
- 5961 N Falls Circle Dr
- 5961 N Falls Circle Dr Unit 2118
- 5961 N Falls Circle Dr Unit 3118
- 5961 N Falls Circle Dr Unit 3028
- 5961 N Falls Circle Dr Unit 1128
- 5961 N Falls Circle Dr Unit 2078
- 5961 N Falls Circle Dr Unit 1028
- 5961 N Falls Circle Dr Unit 4098
- 5961 N Falls Circle Dr Unit 3148
- 5961 N Falls Circle Dr Unit 3048
- 5961 N Falls Circle Dr Unit 4138
- 5961 N Falls Circle Dr Unit 1088