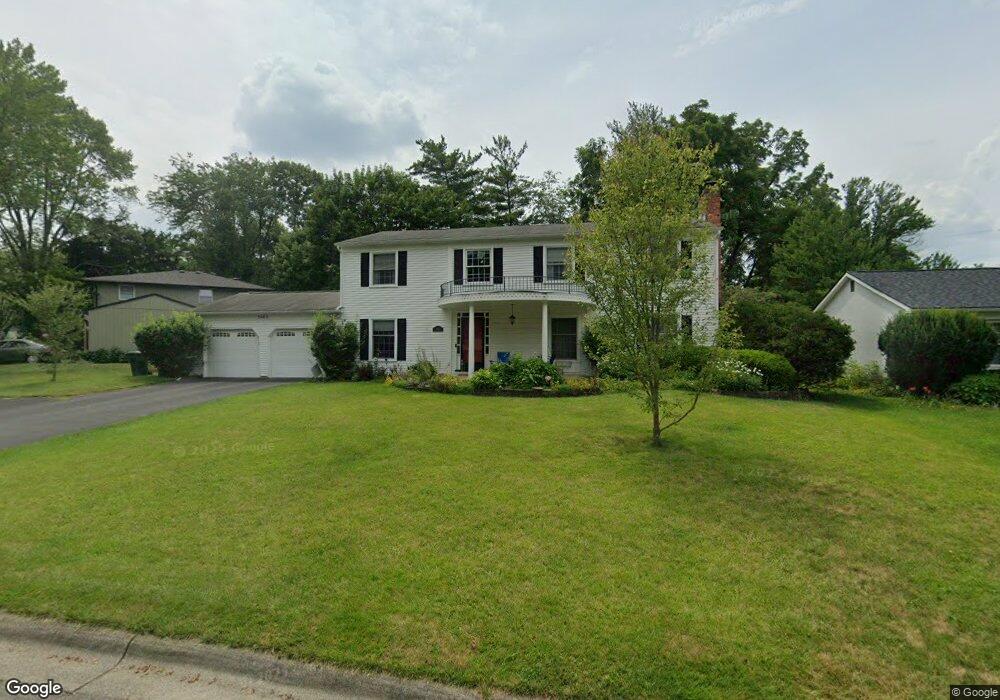
5963 Tulip Hill Rd Columbus, OH 43235
Indian Hills NeighborhoodEstimated Value: $513,000 - $631,000
5
Beds
3
Baths
2,688
Sq Ft
$207/Sq Ft
Est. Value
About This Home
This home is located at 5963 Tulip Hill Rd, Columbus, OH 43235 and is currently estimated at $557,266, approximately $207 per square foot. 5963 Tulip Hill Rd is a home located in Franklin County with nearby schools including Gables Elementary School, Ridgeview Middle School, and Centennial High School.
Ownership History
Date
Name
Owned For
Owner Type
Purchase Details
Closed on
Jun 19, 2009
Sold by
Torok Jason E and Torok Heidi L
Bought by
Moore Jason D and Pack Jamison D
Current Estimated Value
Home Financials for this Owner
Home Financials are based on the most recent Mortgage that was taken out on this home.
Original Mortgage
$216,000
Outstanding Balance
$142,607
Interest Rate
5.62%
Mortgage Type
Purchase Money Mortgage
Estimated Equity
$414,659
Purchase Details
Closed on
Jun 27, 2003
Sold by
Dolan Michael P and Dolan Frances S
Bought by
Torok Jason E and Torok Heidi L
Home Financials for this Owner
Home Financials are based on the most recent Mortgage that was taken out on this home.
Original Mortgage
$216,700
Interest Rate
5.36%
Mortgage Type
Purchase Money Mortgage
Purchase Details
Closed on
Feb 1, 1988
Bought by
Dolan Michael P
Create a Home Valuation Report for This Property
The Home Valuation Report is an in-depth analysis detailing your home's value as well as a comparison with similar homes in the area
Home Values in the Area
Average Home Value in this Area
Purchase History
| Date | Buyer | Sale Price | Title Company |
|---|---|---|---|
| Moore Jason D | -- | Stewart Tit | |
| Torok Jason E | $255,000 | Title First Agency Inc | |
| Dolan Michael P | $161,500 | -- |
Source: Public Records
Mortgage History
| Date | Status | Borrower | Loan Amount |
|---|---|---|---|
| Open | Moore Jason D | $216,000 | |
| Previous Owner | Torok Jason E | $216,700 |
Source: Public Records
Tax History Compared to Growth
Tax History
| Year | Tax Paid | Tax Assessment Tax Assessment Total Assessment is a certain percentage of the fair market value that is determined by local assessors to be the total taxable value of land and additions on the property. | Land | Improvement |
|---|---|---|---|---|
| 2024 | $6,905 | $153,860 | $54,390 | $99,470 |
| 2023 | $6,817 | $153,860 | $54,390 | $99,470 |
| 2022 | $6,564 | $126,560 | $34,790 | $91,770 |
| 2021 | $6,576 | $126,560 | $34,790 | $91,770 |
| 2020 | $6,584 | $126,560 | $34,790 | $91,770 |
| 2019 | $6,045 | $99,650 | $27,830 | $71,820 |
| 2018 | $5,789 | $99,650 | $27,830 | $71,820 |
| 2017 | $6,075 | $99,650 | $27,830 | $71,820 |
| 2016 | $6,110 | $92,230 | $21,740 | $70,490 |
| 2015 | $5,546 | $92,230 | $21,740 | $70,490 |
| 2014 | $5,560 | $92,230 | $21,740 | $70,490 |
| 2013 | $2,611 | $87,815 | $20,685 | $67,130 |
Source: Public Records
Map
Nearby Homes
- 5881 Rocky Rill Rd
- 6041 Rocky Rill Rd
- 838 Cambridge Ct
- 5854 Aqua Bay Dr Unit 5854
- 5936 Aqua Bay Dr
- 5938 Aqua Bay Dr
- 5773 Middlefield Dr
- 6105 Flora Villa Dr
- 895 Linworth Village Dr
- 928 Linworth Village Dr
- 6577 Plesenton Dr S
- 1505 Eastmeadow Place
- 511 W Kanawha Ave
- 1246 Southport Dr
- 1037 Ravine Ridge Dr
- 301 W Riverglen Dr
- 5016 Postlewaite Rd Unit 5016
- 1213 Nantucket Ave
- 1307 Lakeside Ct
- 5363 Godown Rd
- 5951 Tulip Hill Rd
- 5975 Tulip Hill Rd
- 5970 Winstead Rd
- 5956 Winstead Rd
- 5960 Tulip Hill Rd
- 5987 Tulip Hill Rd
- 5984 Winstead Rd
- 5972 Tulip Hill Rd
- 5956 Tulip Hill Rd
- 5954 Tulip Hill Rd
- 5984 Tulip Hill Rd
- 5948 Tulip Hill Rd
- 6000 Winstead Rd
- 6001 Tulip Hill Rd
- 5928 Winstead Rd
- 942 Spring Grove Ln
- 973 Lynbrook Rd
- 946 Spring Grove Ln
- 5967 Winstead Rd
- 5953 Winstead Rd