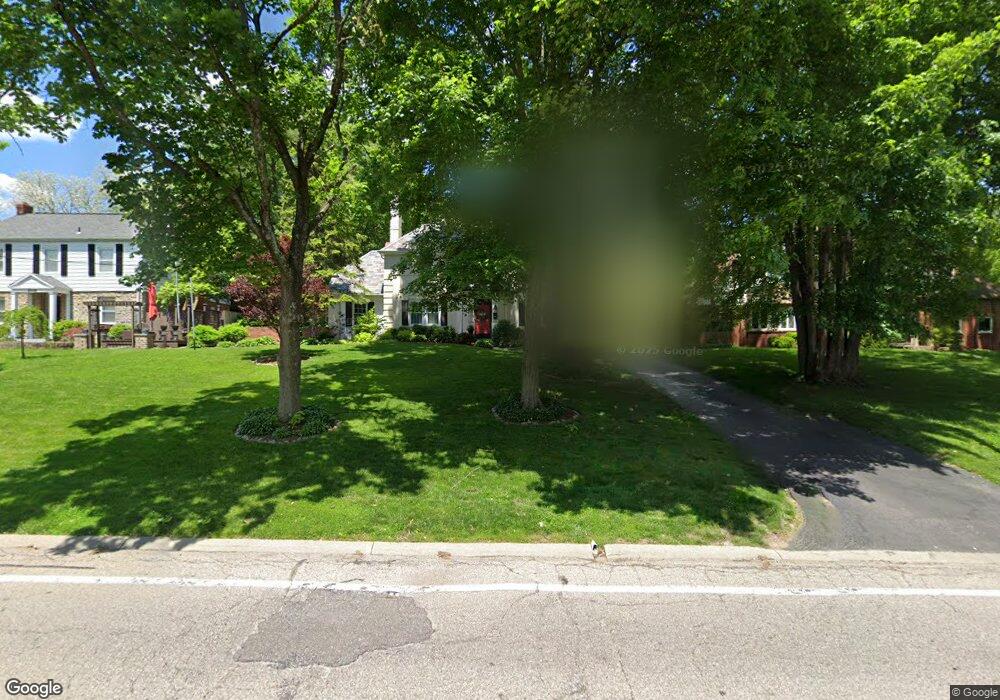
5964 Euclid Rd Cincinnati, OH 45236
Estimated Value: $532,000 - $656,000
4
Beds
4
Baths
2,210
Sq Ft
$263/Sq Ft
Est. Value
About This Home
This home is located at 5964 Euclid Rd, Cincinnati, OH 45236 and is currently estimated at $581,116, approximately $262 per square foot. 5964 Euclid Rd is a home located in Hamilton County with nearby schools including Indian Hill Primary School, Indian Hill Elementary School, and Indian Hill Middle School.
Ownership History
Date
Name
Owned For
Owner Type
Purchase Details
Closed on
Apr 18, 2025
Sold by
Sheeran Patrick H and Sheeran Robbie K
Bought by
Brown David Isaiah and Brown Margaret R
Current Estimated Value
Home Financials for this Owner
Home Financials are based on the most recent Mortgage that was taken out on this home.
Original Mortgage
$494,375
Outstanding Balance
$492,181
Interest Rate
6.65%
Mortgage Type
New Conventional
Estimated Equity
$88,935
Purchase Details
Closed on
Sep 20, 2018
Sold by
Sheeran Patrick H and Sheeran Robbie K
Bought by
Sheeran Patrick H and Sheeran Robbie K
Purchase Details
Closed on
May 1, 2001
Sold by
Morrissey Michael L and Morrissey Martha E
Bought by
Sheeran Patrick H
Home Financials for this Owner
Home Financials are based on the most recent Mortgage that was taken out on this home.
Original Mortgage
$212,000
Interest Rate
6.99%
Create a Home Valuation Report for This Property
The Home Valuation Report is an in-depth analysis detailing your home's value as well as a comparison with similar homes in the area
Home Values in the Area
Average Home Value in this Area
Purchase History
| Date | Buyer | Sale Price | Title Company |
|---|---|---|---|
| Brown David Isaiah | $585,000 | Mattingly Ford Title | |
| Brown David Isaiah | $585,000 | Mattingly Ford Title | |
| Sheeran Patrick H | -- | None Available | |
| Sheeran Patrick H | $265,000 | -- |
Source: Public Records
Mortgage History
| Date | Status | Borrower | Loan Amount |
|---|---|---|---|
| Open | Brown David Isaiah | $494,375 | |
| Closed | Brown David Isaiah | $494,375 | |
| Previous Owner | Sheeran Patrick H | $212,000 |
Source: Public Records
Tax History Compared to Growth
Tax History
| Year | Tax Paid | Tax Assessment Tax Assessment Total Assessment is a certain percentage of the fair market value that is determined by local assessors to be the total taxable value of land and additions on the property. | Land | Improvement |
|---|---|---|---|---|
| 2024 | $5,550 | $142,059 | $33,688 | $108,371 |
| 2023 | $5,583 | $142,059 | $33,688 | $108,371 |
| 2022 | $5,224 | $108,756 | $23,044 | $85,712 |
| 2021 | $5,088 | $108,756 | $23,044 | $85,712 |
| 2020 | $4,539 | $108,756 | $23,044 | $85,712 |
| 2019 | $4,270 | $95,400 | $20,213 | $75,187 |
| 2018 | $4,280 | $95,400 | $20,213 | $75,187 |
| 2017 | $4,081 | $95,400 | $20,213 | $75,187 |
| 2016 | $3,547 | $82,177 | $18,393 | $63,784 |
| 2015 | $3,573 | $82,177 | $18,393 | $63,784 |
| 2014 | $3,551 | $82,177 | $18,393 | $63,784 |
| 2013 | $3,506 | $78,264 | $17,518 | $60,746 |
Source: Public Records
Map
Nearby Homes
- 7620 Montgomery Rd
- 4385 Grinnell Dr
- 7123 Silver Crest Dr
- 6887 Kenwood Rd
- 4248 South Ave
- 4251 Webster Ave
- 6866 Kenwood Rd
- 4268 Glenway Ave
- 6733 Stoll Ln
- 4279 Hegner Ave
- 6808 Sampson Ln
- 4576 Orchard Ln
- 4425 Clifford Rd
- 4126 Orchard Ln
- 6820 Alpine Ave
- 4106 Orchard Ln
- 7800 Spirea Dr
- 4255 Redmont Ave
- 6829 Alpine Ave
- 5948 Euclid Rd
- 5982 Euclid Rd
- 5993 Saint Regis Dr
- 5998 Euclid Rd
- 6001 Saint Regis Dr
- 6921 Fox Hill Ln
- 5987 Saint Regis Dr
- 6929 Fox Hill Ln
- 5920 Euclid Rd
- 6920 Ken Arbre Dr
- 6905 Fox Hill Ln
- 6011 Saint Regis Dr
- 5975 Saint Regis Dr
- 6012 Euclid Rd
- 6924 Ken Arbre Dr
- 6926 Ken Arbre Dr
- 6021 Saint Regis Dr
- 6887 Fox Hill Ln
- 6928 Ken Arbre Dr
- 6018 Euclid Rd