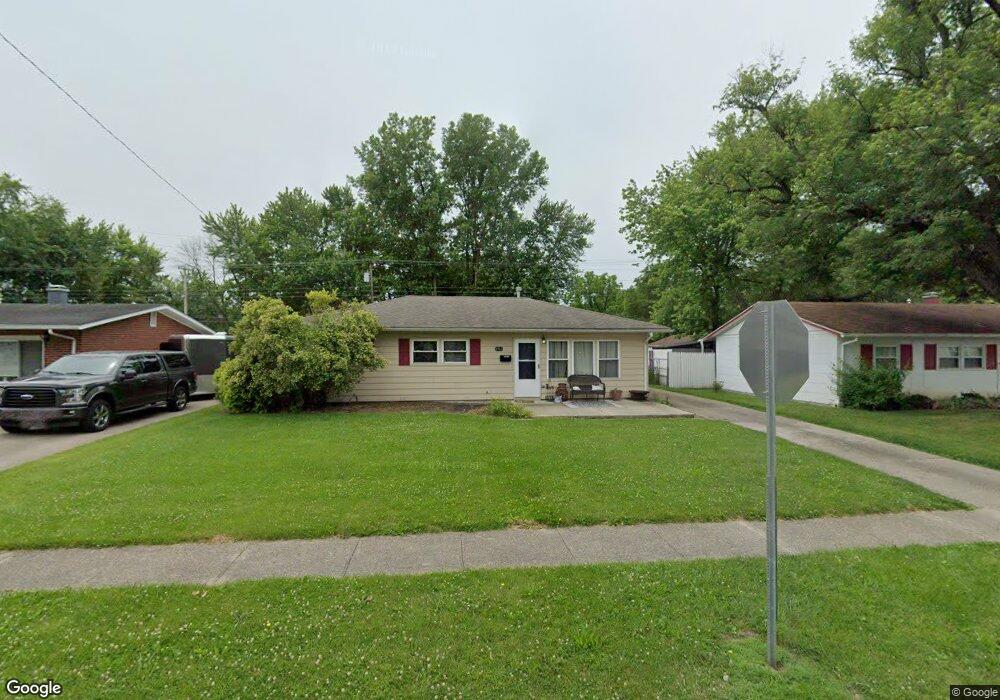
5966 Sharp Rd Dayton, OH 45432
Estimated Value: $171,153 - $198,000
4
Beds
2
Baths
1,046
Sq Ft
$177/Sq Ft
Est. Value
About This Home
This home is located at 5966 Sharp Rd, Dayton, OH 45432 and is currently estimated at $184,788, approximately $176 per square foot. 5966 Sharp Rd is a home located in Montgomery County with nearby schools including Parkwood Elementary School, Herman K Ankeney Middle School, and Beavercreek High School.
Ownership History
Date
Name
Owned For
Owner Type
Purchase Details
Closed on
Nov 21, 2011
Sold by
Schoenfeld Chris
Bought by
Schoenfeld Investments Llc
Current Estimated Value
Purchase Details
Closed on
Oct 29, 2008
Sold by
Fannie Mae
Bought by
2Nd Street Investments Llc
Purchase Details
Closed on
Sep 2, 2008
Sold by
Oliver Carolyn J
Bought by
Federal National Mortgage Association
Create a Home Valuation Report for This Property
The Home Valuation Report is an in-depth analysis detailing your home's value as well as a comparison with similar homes in the area
Home Values in the Area
Average Home Value in this Area
Purchase History
| Date | Buyer | Sale Price | Title Company |
|---|---|---|---|
| Schoenfeld Investments Llc | -- | Attorney | |
| Schoenfeld Chris | -- | Attorney | |
| 2Nd Street Investments Llc | $46,000 | Accutitle Agency Inc | |
| Federal National Mortgage Association | $50,000 | None Available |
Source: Public Records
Tax History
| Year | Tax Paid | Tax Assessment Tax Assessment Total Assessment is a certain percentage of the fair market value that is determined by local assessors to be the total taxable value of land and additions on the property. | Land | Improvement |
|---|---|---|---|---|
| 2025 | $2,562 | $40,750 | $9,640 | $31,110 |
| 2024 | $2,486 | $40,750 | $9,640 | $31,110 |
| 2023 | $2,486 | $40,750 | $9,640 | $31,110 |
| 2022 | $1,904 | $26,640 | $6,300 | $20,340 |
| 2021 | $1,912 | $26,640 | $6,300 | $20,340 |
| 2020 | $1,919 | $26,640 | $6,300 | $20,340 |
| 2019 | $2,006 | $25,390 | $6,300 | $19,090 |
| 2018 | $1,867 | $25,390 | $6,300 | $19,090 |
| 2017 | $1,834 | $25,390 | $6,300 | $19,090 |
| 2016 | $1,824 | $24,220 | $6,300 | $17,920 |
| 2015 | $1,979 | $24,220 | $6,300 | $17,920 |
| 2014 | $1,979 | $24,220 | $6,300 | $17,920 |
| 2012 | -- | $24,790 | $7,000 | $17,790 |
Source: Public Records
Map
Nearby Homes
- 6000 Sharp Rd
- 5943 Sharp Rd
- 5588 Sharp Rd
- 5713 Mayville Dr
- 5664 Mayville Dr
- 1176 Irmal Dr
- 1792 Stedman Ln
- 1538 Lytton Place
- Lot 10 Linden Ave
- Lot 11 Linden Ave
- 4460 Mohave Dr
- 4174 Mapleview Dr
- 1301 Ames Ave
- 1726 Rausch Ave
- 4083 Dayton Xenia Rd
- 4328 Richland Ave
- 1792 Nugget Ct
- 1622 Seabrook Rd
- 4301 Richland Ave
- 4931 Arcadia Blvd
- 5978 Sharp Rd
- 5956 Sharp Rd
- 5944 Sharp Rd
- 5988 Sharp Rd
- 5934 Sharp Rd
- 5957 Sharp Rd
- 1290 Jeanette Dr
- 5922 Sharp Rd
- 1284 Jeanette Dr
- 4489 Ardonna Ln
- 5927 Sharp Rd
- 1277 Jeanette Dr
- 5912 Sharp Rd
- 1278 Jeanette Dr
- 4486 Ardonna Ln
- 1266 Reedsdale Rd
- 1271 Jeanette Dr
- 5900 Sharp Rd
- 1272 Jeanette Dr
- 5901 Sharp Rd
Your Personal Tour Guide
Ask me questions while you tour the home.