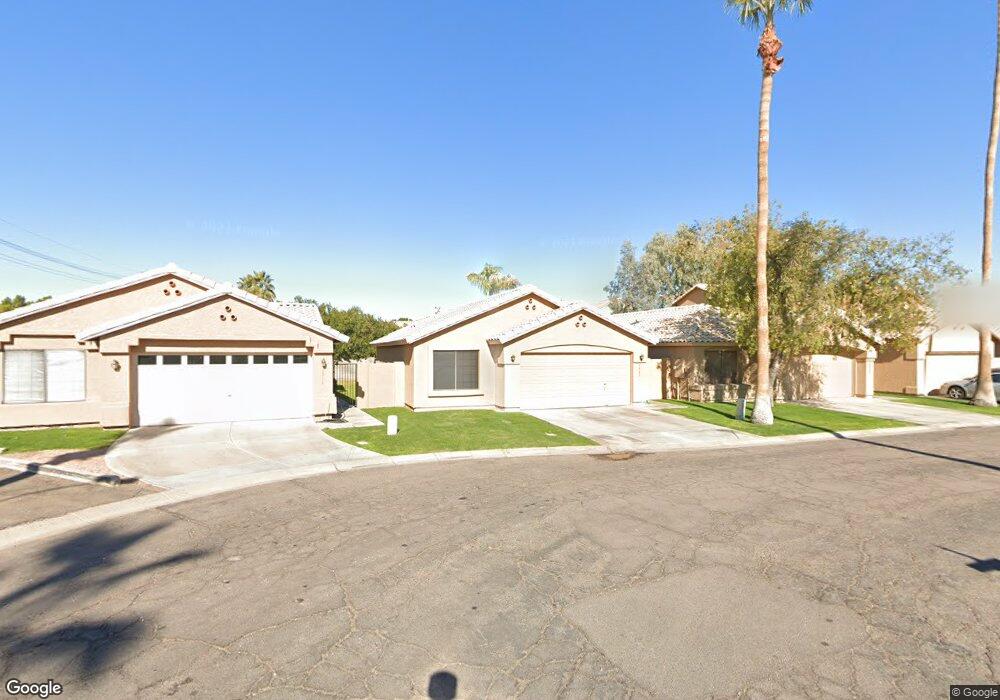
5966 W Drake Ct Chandler, AZ 85226
West Chandler NeighborhoodEstimated Value: $374,853 - $446,000
3
Beds
2
Baths
1,343
Sq Ft
$312/Sq Ft
Est. Value
About This Home
This home is located at 5966 W Drake Ct, Chandler, AZ 85226 and is currently estimated at $419,463, approximately $312 per square foot. 5966 W Drake Ct is a home located in Maricopa County with nearby schools including Kyrene de la Mirada Elementary School, Kyrene del Pueblo Middle School, and Corona Del Sol High School.
Ownership History
Date
Name
Owned For
Owner Type
Purchase Details
Closed on
Oct 25, 2011
Sold by
Barton Linda Rita
Bought by
Schneider Deborah
Current Estimated Value
Home Financials for this Owner
Home Financials are based on the most recent Mortgage that was taken out on this home.
Original Mortgage
$126,704
Outstanding Balance
$87,354
Interest Rate
4.25%
Mortgage Type
FHA
Estimated Equity
$332,109
Purchase Details
Closed on
Jul 15, 2009
Sold by
Barton Linda R and Barton Linda Rita
Bought by
Barton Linda Rita and Linda Rita Barton Living Trust
Purchase Details
Closed on
Mar 25, 2009
Sold by
Wickliff Sandra S
Bought by
Barton Linda R
Home Financials for this Owner
Home Financials are based on the most recent Mortgage that was taken out on this home.
Original Mortgage
$124,112
Interest Rate
5.04%
Mortgage Type
Purchase Money Mortgage
Purchase Details
Closed on
Nov 15, 2004
Sold by
Wickliff Sandra S
Bought by
Wickliff Sandra S
Create a Home Valuation Report for This Property
The Home Valuation Report is an in-depth analysis detailing your home's value as well as a comparison with similar homes in the area
Home Values in the Area
Average Home Value in this Area
Purchase History
| Date | Buyer | Sale Price | Title Company |
|---|---|---|---|
| Schneider Deborah | $130,000 | Infinity Title Agency | |
| Barton Linda Rita | -- | None Available | |
| Barton Linda R | $155,140 | Security Title Agency | |
| Wickliff Sandra S | -- | -- |
Source: Public Records
Mortgage History
| Date | Status | Borrower | Loan Amount |
|---|---|---|---|
| Open | Schneider Deborah | $126,704 | |
| Previous Owner | Barton Linda R | $124,112 |
Source: Public Records
Tax History Compared to Growth
Tax History
| Year | Tax Paid | Tax Assessment Tax Assessment Total Assessment is a certain percentage of the fair market value that is determined by local assessors to be the total taxable value of land and additions on the property. | Land | Improvement |
|---|---|---|---|---|
| 2025 | $1,521 | $19,096 | -- | -- |
| 2024 | $1,455 | $18,187 | -- | -- |
| 2023 | $1,455 | $32,150 | $6,430 | $25,720 |
| 2022 | $1,385 | $23,600 | $4,720 | $18,880 |
| 2021 | $1,461 | $21,750 | $4,350 | $17,400 |
| 2020 | $1,427 | $20,560 | $4,110 | $16,450 |
| 2019 | $1,385 | $18,320 | $3,660 | $14,660 |
| 2018 | $1,340 | $17,250 | $3,450 | $13,800 |
| 2017 | $1,277 | $16,130 | $3,220 | $12,910 |
| 2016 | $1,303 | $14,850 | $2,970 | $11,880 |
| 2015 | $1,203 | $14,130 | $2,820 | $11,310 |
Source: Public Records
Map
Nearby Homes
- 5959 W Del Rio St
- 5751 W Del Rio St
- 5726 W Ivanhoe St
- 500 N Roosevelt Ave Unit 2
- 500 N Roosevelt Ave Unit 87
- 500 N Roosevelt Ave Unit 40
- 500 N Roosevelt Ave Unit 26
- 500 N Gila Springs Blvd Unit 230
- 500 N Gila Springs Blvd Unit 113
- 5665 W Galveston St Unit 76
- 6302 W Megan St
- 300 N Gila Springs Blvd Unit 181
- 881 N Pineview Dr
- 6491 W Linda Ln
- 687 N Gregory Place
- 6570 W Linda Ct
- 6551 W Shannon Ct Unit 1
- 6450 W Gary Dr
- 5291 W Del Rio St
- 6673 W Ivanhoe St
- 5958 W Drake Ct
- 5974 W Drake Ct
- 5950 W Drake Ct
- 5959 W Harrison St
- 690 N Aspen Dr
- 5942 W Drake Ct
- 5959 W Drake Ct
- 5951 W Drake Ct
- 680 N Aspen Dr
- 5949 W Harrison St
- 5943 W Drake Ct
- 5934 W Drake Ct
- 700 N Aspen Dr
- 670 N Aspen Dr
- 661 N Aspen Dr
- 5926 W Drake Ct
- 5935 W Drake Ct
- 5939 W Harrison St
- 660 N Aspen Dr
- 651 N Aspen Dr