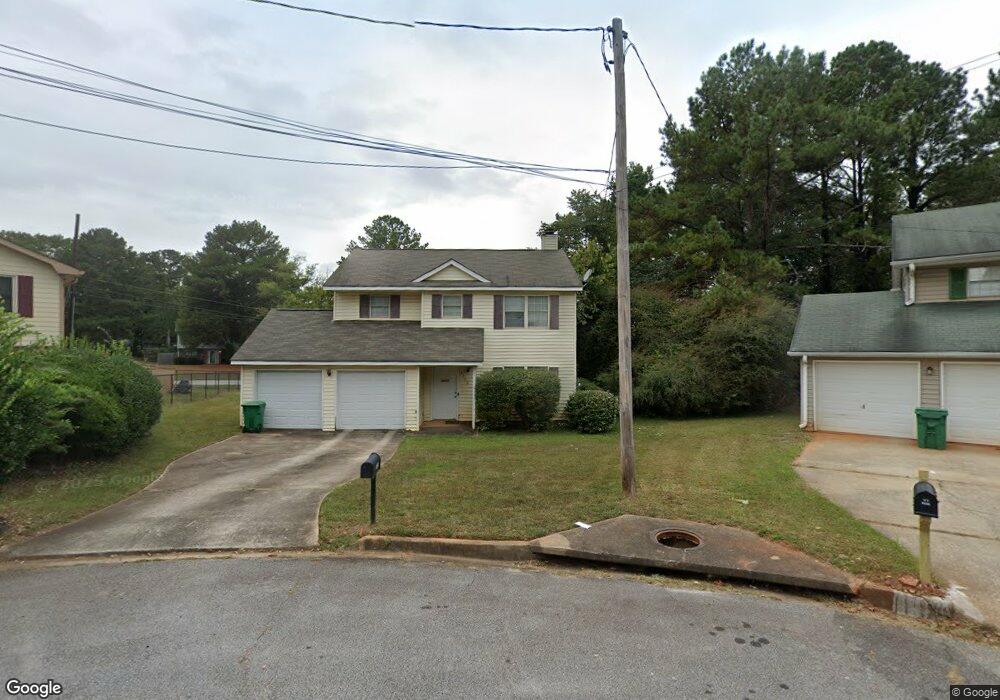
5966 Wellborn Trace Lithonia, GA 30058
Estimated Value: $206,000 - $239,000
3
Beds
3
Baths
1,455
Sq Ft
$152/Sq Ft
Est. Value
About This Home
This home is located at 5966 Wellborn Trace, Lithonia, GA 30058 and is currently estimated at $221,811, approximately $152 per square foot. 5966 Wellborn Trace is a home located in DeKalb County with nearby schools including Redan Elementary School, Lithonia Middle School, and Lithonia High School.
Ownership History
Date
Name
Owned For
Owner Type
Purchase Details
Closed on
Oct 11, 2019
Sold by
Wce Holdings B Llc
Bought by
Ellis Refinance Portfolio Llc
Current Estimated Value
Purchase Details
Closed on
Jul 11, 2014
Sold by
Sfr Properties Llc
Bought by
Wce Holdings B Llc
Home Financials for this Owner
Home Financials are based on the most recent Mortgage that was taken out on this home.
Original Mortgage
$64,713
Interest Rate
4.26%
Mortgage Type
New Conventional
Purchase Details
Closed on
Mar 4, 2003
Sold by
Moses Colleen
Bought by
Sfr Properties Llc
Purchase Details
Closed on
Jul 29, 2002
Sold by
Miller Michael A
Bought by
Scheinfeld P Novy
Home Financials for this Owner
Home Financials are based on the most recent Mortgage that was taken out on this home.
Original Mortgage
$98,050
Interest Rate
6.67%
Purchase Details
Closed on
Jul 1, 2002
Sold by
Sfr Properties Llc
Bought by
Moses Colleen
Home Financials for this Owner
Home Financials are based on the most recent Mortgage that was taken out on this home.
Original Mortgage
$98,050
Interest Rate
6.67%
Create a Home Valuation Report for This Property
The Home Valuation Report is an in-depth analysis detailing your home's value as well as a comparison with similar homes in the area
Home Values in the Area
Average Home Value in this Area
Purchase History
| Date | Buyer | Sale Price | Title Company |
|---|---|---|---|
| Ellis Refinance Portfolio Llc | -- | -- | |
| Ellis Refinance Portfolio Llc | -- | -- | |
| Wce Holdings B Llc | $27,000 | -- | |
| Sfr Properties Llc | $75,000 | -- | |
| Scheinfeld P Novy | -- | -- | |
| Moses Colleen | $103,000 | -- | |
| Sfr Properties Llc | -- | -- |
Source: Public Records
Mortgage History
| Date | Status | Borrower | Loan Amount |
|---|---|---|---|
| Previous Owner | Wce Holdings B Llc | $64,713 | |
| Previous Owner | Sfr Properties Llc | $98,050 |
Source: Public Records
Tax History Compared to Growth
Tax History
| Year | Tax Paid | Tax Assessment Tax Assessment Total Assessment is a certain percentage of the fair market value that is determined by local assessors to be the total taxable value of land and additions on the property. | Land | Improvement |
|---|---|---|---|---|
| 2025 | $4,234 | $86,800 | $14,240 | $72,560 |
| 2024 | $3,383 | $67,400 | $14,154 | $53,246 |
| 2023 | $3,383 | $67,400 | $14,154 | $53,246 |
| 2022 | $2,044 | $68,160 | $14,240 | $53,920 |
| 2021 | $2,044 | $39,080 | $5,720 | $33,360 |
| 2020 | $2,044 | $39,080 | $5,720 | $33,360 |
| 2019 | $1,840 | $40,520 | $5,720 | $34,800 |
| 2018 | $1,328 | $34,480 | $2,240 | $32,240 |
| 2017 | $1,750 | $32,240 | $2,240 | $30,000 |
| 2016 | $1,794 | $33,160 | $2,240 | $30,920 |
| 2014 | $979 | $14,360 | $2,200 | $12,160 |
Source: Public Records
Map
Nearby Homes
- 2063 Wellborn Close
- 2030 Hilda Burns Place
- 2089 Quilt Ct
- 2138 Tiffany Trail
- 2158 Sara Ashley Way
- 2045 Lown Farm Trail Unit 3
- 2067 Raintree Place
- 2128 Tiffany Ln
- 6047 Marbut Rd
- 6082 Raintree Bend
- 2169 Tiffany Ln
- 2202 Lowtrail Ct
- 2123 Lown Farm Ln
- 2039 Raintree Place
- 2218 Lowtrail Ct
- 5822 Cedar Croft Ln
- 5972 Giles Rd
- 5786 Singer Ct
- 5851 Giles Rd
- 5813 Wellborn Oaks Ct
- 5968 Wellborn Trace
- 5962 Wellborn Trace
- 5972 Wellborn Trace
- 2018 Wellborn Rd
- 5965 Wellborn Trace
- 2035 Wellborn Rd Unit 1
- 2047 Marbut Ln Unit 10
- 2047 Marbut Ln
- 5978 Wellborn Trace
- 2023 Wellborn Rd
- 2045 Wellborn Rd Unit 1
- 2048 Wellborn Rd
- 5967 Great Oaks Dr
- 2055 Marbut Ln
- 5984 Wellborn Trace
- 2046 Marbut Ln
- 5931 Poplin Ct Unit 1
- 5975 Great Oaks Dr Unit 2
- 2052 Wellborn Rd
- 5932 Poplin Ct