Estimated Value: $283,000 - $414,000
4
Beds
2
Baths
1,447
Sq Ft
$252/Sq Ft
Est. Value
About This Home
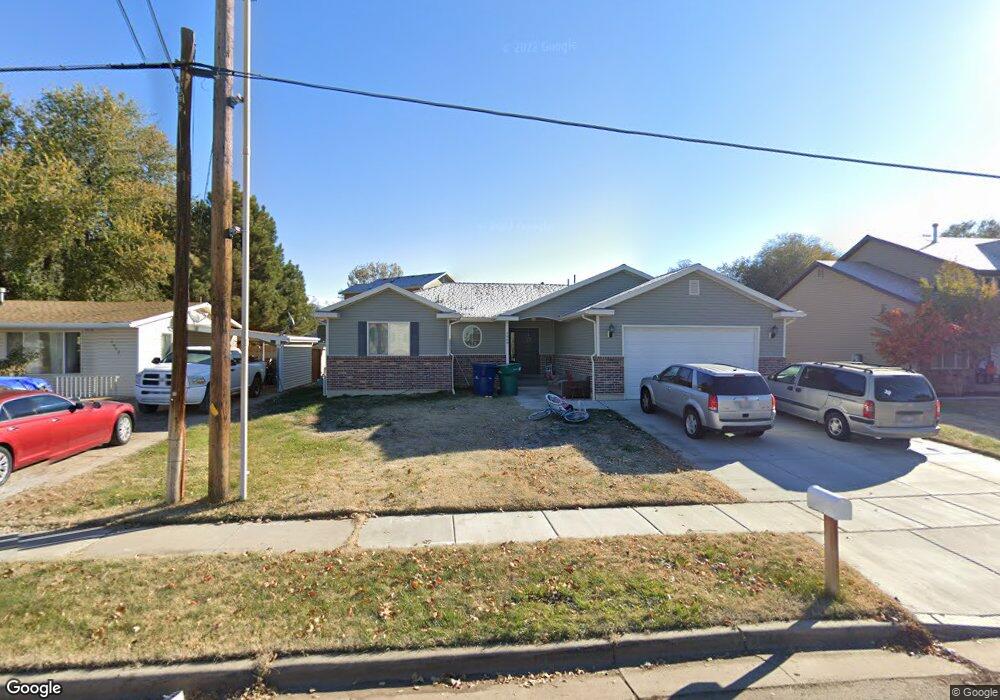
This home is located at 5968 S 2700 W Unit 2, Roy, UT 84067 and is currently estimated at $364,418, approximately $251 per square foot. 5968 S 2700 W Unit 2 is a home located in Weber County with nearby schools including Roy Elementary School, Roy Junior High School, and Roy High School.
Ownership History
Date
Name
Owned For
Owner Type
Purchase Details
Closed on
Aug 16, 2016
Sold by
Housing Management & Development Corpora
Bought by
Corwn At Watterson Llc
Current Estimated Value
Home Financials for this Owner
Home Financials are based on the most recent Mortgage that was taken out on this home.
Original Mortgage
$1,339,050
Outstanding Balance
$1,069,095
Interest Rate
3.5%
Mortgage Type
Credit Line Revolving
Estimated Equity
-$704,677
Purchase Details
Closed on
Jan 8, 2016
Sold by
White Raven Realty Llc
Bought by
Housing Management & Development Corpora
Create a Home Valuation Report for This Property
The Home Valuation Report is an in-depth analysis detailing your home's value as well as a comparison with similar homes in the area
Home Values in the Area
Average Home Value in this Area
Purchase History
| Date | Buyer | Sale Price | Title Company |
|---|---|---|---|
| Corwn At Watterson Llc | -- | First American | |
| Housing Management & Development Corpora | -- | First Amercian Title Insuran |
Source: Public Records
Mortgage History
| Date | Status | Borrower | Loan Amount |
|---|---|---|---|
| Open | Corwn At Watterson Llc | $1,339,050 |
Source: Public Records
Tax History Compared to Growth
Tax History
| Year | Tax Paid | Tax Assessment Tax Assessment Total Assessment is a certain percentage of the fair market value that is determined by local assessors to be the total taxable value of land and additions on the property. | Land | Improvement |
|---|---|---|---|---|
| 2025 | $974 | $124,996 | $25,704 | $99,292 |
| 2024 | $1,069 | $144,000 | $25,896 | $118,104 |
| 2023 | $873 | $110,800 | $106,240 | $4,560 |
| 2022 | $575 | $62,900 | $16,256 | $46,644 |
| 2021 | $747 | $89,250 | $66,175 | $23,075 |
| 2020 | $729 | $81,600 | $66,175 | $15,425 |
| 2019 | $1,026 | $93,500 | $40,928 | $52,572 |
| 2018 | $674 | $35,973 | $35,973 | $0 |
| 2017 | $704 | $35,973 | $35,973 | $0 |
| 2016 | $518 | $35,600 | $35,600 | $0 |
| 2015 | $573 | $40,558 | $40,558 | $0 |
| 2014 | $437 | $30,582 | $30,582 | $0 |
Source: Public Records
Map
Nearby Homes