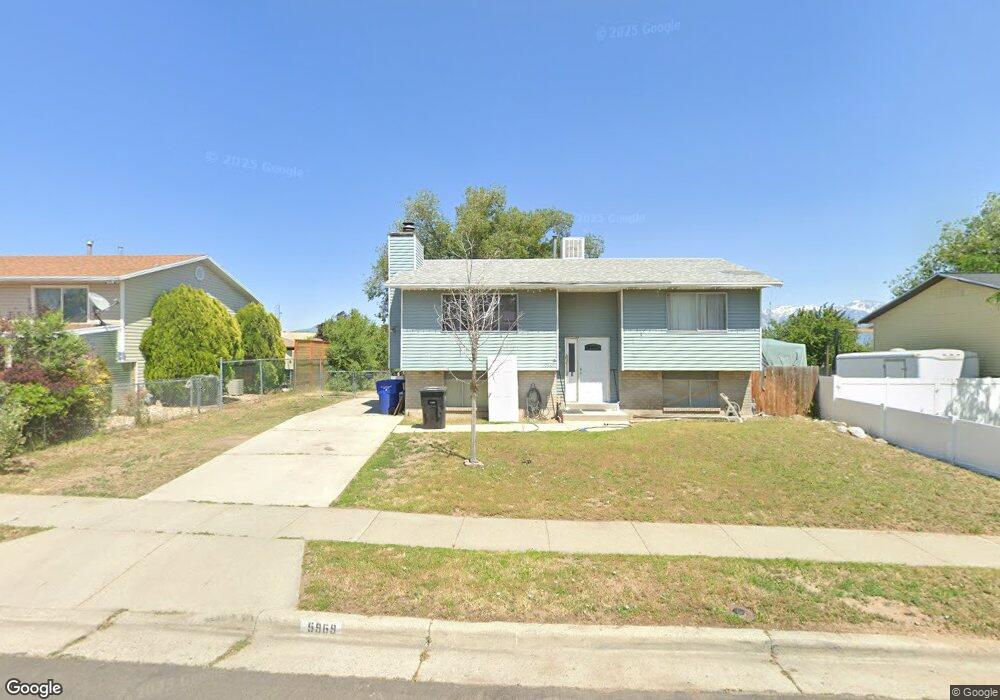
5969 3840 W Taylorsville, UT 84129
Estimated Value: $433,000 - $471,000
4
Beds
2
Baths
1,788
Sq Ft
$255/Sq Ft
Est. Value
About This Home
This home is located at 5969 3840 W, Taylorsville, UT 84129 and is currently estimated at $455,420, approximately $254 per square foot. 5969 3840 W is a home located in Salt Lake County with nearby schools including Fox Hills Elementary School, Kearns Jr High School, and Kearns High School.
Ownership History
Date
Name
Owned For
Owner Type
Purchase Details
Closed on
Nov 12, 2015
Sold by
King Stephen M
Bought by
Henningselw Christa
Current Estimated Value
Purchase Details
Closed on
Apr 25, 2013
Sold by
King Jeanne J
Bought by
King Stephen
Home Financials for this Owner
Home Financials are based on the most recent Mortgage that was taken out on this home.
Original Mortgage
$126,500
Interest Rate
4.11%
Mortgage Type
New Conventional
Purchase Details
Closed on
Jun 16, 2000
Sold by
Young William C and Young Lee Ann
Bought by
King Stephen M and King Jeanne J
Home Financials for this Owner
Home Financials are based on the most recent Mortgage that was taken out on this home.
Original Mortgage
$104,637
Interest Rate
8.27%
Mortgage Type
FHA
Purchase Details
Closed on
Mar 25, 1998
Sold by
Watts Edwin Larsen and Watts Lee Ann
Bought by
Young William C and Young Lee Ann
Home Financials for this Owner
Home Financials are based on the most recent Mortgage that was taken out on this home.
Original Mortgage
$68,250
Interest Rate
7.06%
Create a Home Valuation Report for This Property
The Home Valuation Report is an in-depth analysis detailing your home's value as well as a comparison with similar homes in the area
Home Values in the Area
Average Home Value in this Area
Purchase History
| Date | Buyer | Sale Price | Title Company |
|---|---|---|---|
| Henningselw Christa | -- | None Available | |
| King Stephen | -- | Accommodation | |
| King Stephen M | -- | Superior Title Company | |
| Young William C | -- | -- |
Source: Public Records
Mortgage History
| Date | Status | Borrower | Loan Amount |
|---|---|---|---|
| Previous Owner | King Stephen | $126,500 | |
| Previous Owner | King Stephen M | $104,637 | |
| Previous Owner | Young William C | $68,250 |
Source: Public Records
Tax History Compared to Growth
Tax History
| Year | Tax Paid | Tax Assessment Tax Assessment Total Assessment is a certain percentage of the fair market value that is determined by local assessors to be the total taxable value of land and additions on the property. | Land | Improvement |
|---|---|---|---|---|
| 2025 | $2,285 | $396,900 | $142,500 | $254,400 |
| 2024 | $2,285 | $374,800 | $134,500 | $240,300 |
| 2023 | $2,165 | $327,700 | $129,300 | $198,400 |
| 2022 | $1,978 | $321,000 | $126,800 | $194,200 |
| 2021 | $1,963 | $261,500 | $97,500 | $164,000 |
| 2020 | $2,021 | $229,500 | $90,700 | $138,800 |
| 2019 | $1,906 | $221,300 | $83,500 | $137,800 |
| 2018 | $1,845 | $205,800 | $83,500 | $122,300 |
| 2017 | $1,790 | $191,900 | $83,500 | $108,400 |
| 2016 | $1,354 | $179,100 | $83,500 | $95,600 |
| 2015 | $1,295 | $160,100 | $75,400 | $84,700 |
| 2014 | $1,266 | $153,700 | $73,000 | $80,700 |
Source: Public Records
Map
Nearby Homes
- 5968 3840 W
- 3978 W Marlis Cir
- 5649 Bree St
- 6075 S Zodiac Dr
- 4120 W 5740 S
- 3962 Misty Dr
- 5603 S 4015 W
- 6330 S 4015 W
- 6280 Laura Jo Ln
- 4230 W Stratus St
- 6377 Fairwind Dr
- 6409 S Dixie Dr
- 5836 S 4270 W
- 4161 W 5615 S
- 4207 W 5655 S
- 4319 W Tidwell St
- 4243 W 5655 S
- 6222 S Westbrook Dr
- 5588 S 4170 W
- 6215 S Westbrook Dr
- 5969 Country Hills Dr
- 5959 S Country Hills Dr
- 5959 Country Hills Dr
- 5979 Country Hills Dr
- 5979 S Country Hills Dr
- 5979 S 3840 W
- 5979 S Country Hills Dr
- 5949 S Country Hills Dr
- 5949 Country Hills Dr
- 5989 Country Hills Dr
- 5989 S Country Hills Dr
- 5989 S Country Hills Dr
- 5968 S Country Hills Dr Unit 40
- 5968 S Country Hills Dr
- 5968 Country Hills Dr
- 5958 Country Hills Dr
- 5958 S Country Hills Dr
- 5978 S Country Hills Dr
- 5978 Country Hills Dr
- 5939 Country Hills Dr