Estimated Value: $381,000 - $400,479
4
Beds
1
Bath
1,680
Sq Ft
$231/Sq Ft
Est. Value
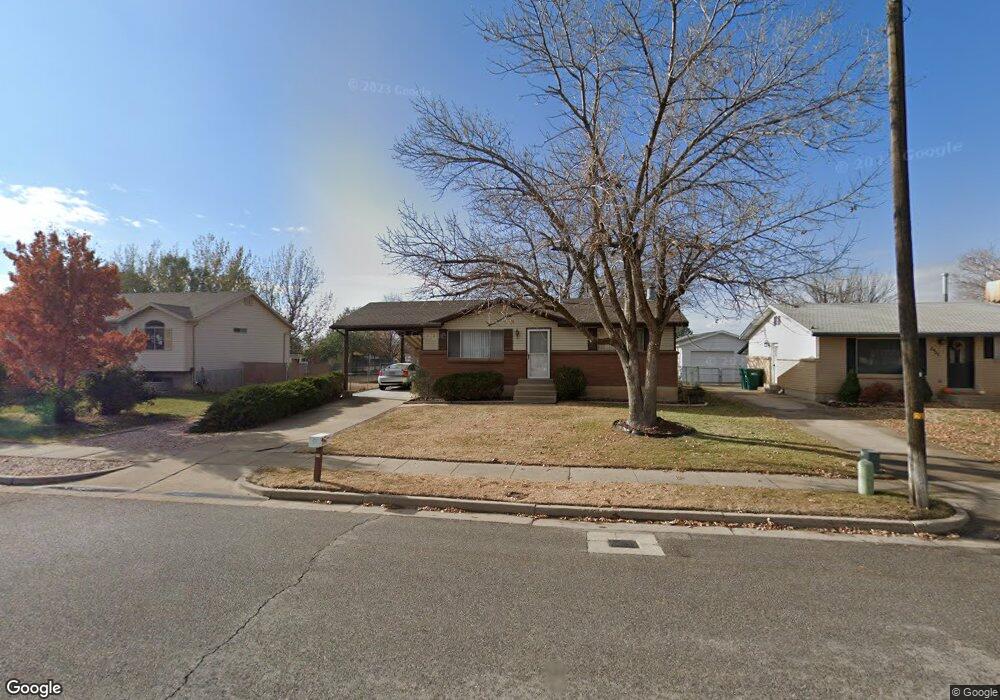
About This Home
This home is located at 5969 S 3000 W, Roy, UT 84067 and is currently estimated at $388,620, approximately $231 per square foot. 5969 S 3000 W is a home located in Weber County with nearby schools including Roy Elementary School, Roy Junior High School, and Roy High School.
Ownership History
Date
Name
Owned For
Owner Type
Purchase Details
Closed on
Mar 23, 2023
Sold by
Dale Roy Hartley Living Trust
Bought by
Henderson Jason and Henderson Jennifer
Current Estimated Value
Home Financials for this Owner
Home Financials are based on the most recent Mortgage that was taken out on this home.
Original Mortgage
$328,932
Outstanding Balance
$318,587
Interest Rate
6.12%
Mortgage Type
FHA
Estimated Equity
$70,033
Purchase Details
Closed on
Oct 30, 2021
Sold by
Hartley Dale R
Bought by
Dale Roy Hartley Living Trust and Hartley
Create a Home Valuation Report for This Property
The Home Valuation Report is an in-depth analysis detailing your home's value as well as a comparison with similar homes in the area
Home Values in the Area
Average Home Value in this Area
Purchase History
| Date | Buyer | Sale Price | Title Company |
|---|---|---|---|
| Henderson Jason | -- | Amicus Title | |
| Dale Roy Hartley Living Trust | -- | None Listed On Document |
Source: Public Records
Mortgage History
| Date | Status | Borrower | Loan Amount |
|---|---|---|---|
| Open | Henderson Jason | $328,932 |
Source: Public Records
Tax History
| Year | Tax Paid | Tax Assessment Tax Assessment Total Assessment is a certain percentage of the fair market value that is determined by local assessors to be the total taxable value of land and additions on the property. | Land | Improvement |
|---|---|---|---|---|
| 2025 | $2,240 | $348,444 | $125,233 | $223,211 |
| 2024 | $2,189 | $188,649 | $68,878 | $119,771 |
| 2023 | $2,121 | $183,150 | $67,156 | $115,994 |
| 2022 | $2,330 | $209,550 | $59,493 | $150,057 |
| 2021 | $481 | $281,000 | $77,323 | $203,677 |
| 2020 | $386 | $234,000 | $77,323 | $156,677 |
| 2019 | $338 | $205,000 | $46,848 | $158,152 |
| 2018 | $256 | $171,000 | $44,899 | $126,101 |
| 2017 | $224 | $149,000 | $44,899 | $104,101 |
| 2016 | $188 | $75,337 | $21,628 | $53,709 |
| 2015 | $186 | $67,738 | $21,628 | $46,110 |
| 2014 | $184 | $65,934 | $21,628 | $44,306 |
Source: Public Records
Map
Nearby Homes
- 5957 S 3000 W
- 5971 S 3000 W
- 5971 S 3000 W Unit 1
- 5933 S 3000 W
- 5973 S 3000 W
- 5973 S 3000 W Unit 2
- 5966 S 3000 W
- 5897 S 3000 W
- 5954 S 3000 W
- 5970 S 3000 W
- 5970 S 3000 W Unit 10
- 5970 S 3000 W Unit 9
- 5932 S 3000 W
- 5977 S 3000 W
- 5977 S 3000 W Unit 3
- 5869 S 3000 W
- 5972 S 3000 W
- 5972 S 3000 W Unit 9
- 5972 S 3000 W Unit 8
- 5898 S 3000 W
Your Personal Tour Guide
Ask me questions while you tour the home.