Estimated Value: $245,000 - $281,000
3
Beds
3
Baths
1,624
Sq Ft
$164/Sq Ft
Est. Value
About This Home
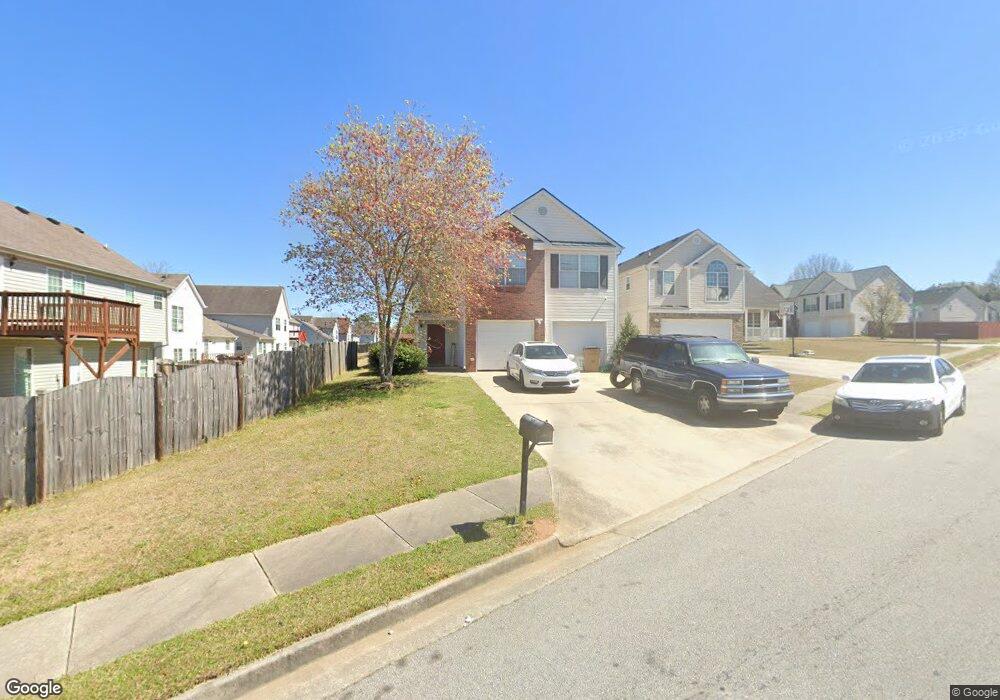
This home is located at 5969 Waggoner Ct, Rex, GA 30273 and is currently estimated at $266,712, approximately $164 per square foot. 5969 Waggoner Ct is a home located in Clayton County with nearby schools including East Clayton Elementary School, Adamson Middle School, and Morrow High School.
Ownership History
Date
Name
Owned For
Owner Type
Purchase Details
Closed on
Feb 2, 2021
Sold by
Akano Beverly
Bought by
Jones Dadrian
Current Estimated Value
Home Financials for this Owner
Home Financials are based on the most recent Mortgage that was taken out on this home.
Original Mortgage
$183,350
Outstanding Balance
$163,844
Interest Rate
2.65%
Mortgage Type
New Conventional
Estimated Equity
$102,868
Purchase Details
Closed on
Jan 20, 2006
Sold by
Gt Homes Llc
Bought by
Akano Beverly
Home Financials for this Owner
Home Financials are based on the most recent Mortgage that was taken out on this home.
Original Mortgage
$148,470
Interest Rate
6.22%
Mortgage Type
FHA
Purchase Details
Closed on
Jun 3, 2005
Sold by
Southside Dev Inc
Bought by
Gt Homes Llc
Home Financials for this Owner
Home Financials are based on the most recent Mortgage that was taken out on this home.
Original Mortgage
$1,591,770
Interest Rate
5.66%
Create a Home Valuation Report for This Property
The Home Valuation Report is an in-depth analysis detailing your home's value as well as a comparison with similar homes in the area
Home Values in the Area
Average Home Value in this Area
Purchase History
| Date | Buyer | Sale Price | Title Company |
|---|---|---|---|
| Jones Dadrian | $193,000 | -- | |
| Akano Beverly | $150,800 | -- | |
| Gt Homes Llc | $585,000 | -- |
Source: Public Records
Mortgage History
| Date | Status | Borrower | Loan Amount |
|---|---|---|---|
| Open | Jones Dadrian | $183,350 | |
| Previous Owner | Akano Beverly | $148,470 | |
| Previous Owner | Gt Homes Llc | $1,591,770 |
Source: Public Records
Tax History Compared to Growth
Tax History
| Year | Tax Paid | Tax Assessment Tax Assessment Total Assessment is a certain percentage of the fair market value that is determined by local assessors to be the total taxable value of land and additions on the property. | Land | Improvement |
|---|---|---|---|---|
| 2024 | $3,498 | $98,680 | $8,800 | $89,880 |
| 2023 | $3,505 | $97,080 | $8,800 | $88,280 |
| 2022 | $2,839 | $81,360 | $8,800 | $72,560 |
| 2021 | $2,092 | $62,000 | $8,800 | $53,200 |
| 2020 | $1,967 | $58,235 | $8,800 | $49,435 |
| 2019 | $1,639 | $49,425 | $8,800 | $40,625 |
| 2018 | $1,417 | $43,959 | $8,800 | $35,159 |
| 2017 | $1,154 | $37,418 | $8,800 | $28,618 |
| 2016 | $811 | $28,995 | $8,800 | $20,195 |
| 2015 | $707 | $0 | $0 | $0 |
| 2014 | $686 | $26,275 | $9,600 | $16,675 |
Source: Public Records
Map
Nearby Homes
- 3456 Heartland Dr Unit 2
- 3130 Rex Ridge Cir
- 3548 Meadowview Ct
- 6061 Tina Ln
- 5652 Laney Dr
- 5705 Laney Dr
- 5631 Laney Dr
- 5610 Swanson Rd
- 5810 Mistyview Dr Unit 3
- 3078 Caliente Ln
- 5578 Swanson Rd
- 6139 Katherine Rd
- 6103 Chaseland Dr
- 6103 Chaseland Rd
- 6057 Dorchester Dr
- 5861 Colonnade Dr
- 3694 Rex Rd
- 3645 Fay Dr Unit 1
- 3203 Pawnee Dr
- 3709 Charlotte Dr
- 5959 Waggoner Ct
- 5963 Waggoner Ct
- 3325 Waggoner Way
- 3331 Waggoner Way Unit 3331
- 3331 Waggoner Way Unit 152C
- 3330 Waggoner Ln
- 3337 Waggoner Way
- 0 Waggoner Ct Unit 7494596
- 0 Waggoner Ct Unit 7478331
- 0 Waggoner Ct Unit 7396562
- 0 Waggoner Ct Unit 7293577
- 0 Waggoner Ct Unit 7073731
- 0 Waggoner Ct Unit 7049360
- 0 Waggoner Ct Unit 3247936
- 0 Waggoner Ct Unit 8871756
- 0 Waggoner Ct Unit 8700930
- 0 Waggoner Ct Unit 8451729
- 0 Waggoner Ct Unit 8305166
- 0 Waggoner Ct Unit 8270268
- 0 Waggoner Ct Unit 7143080