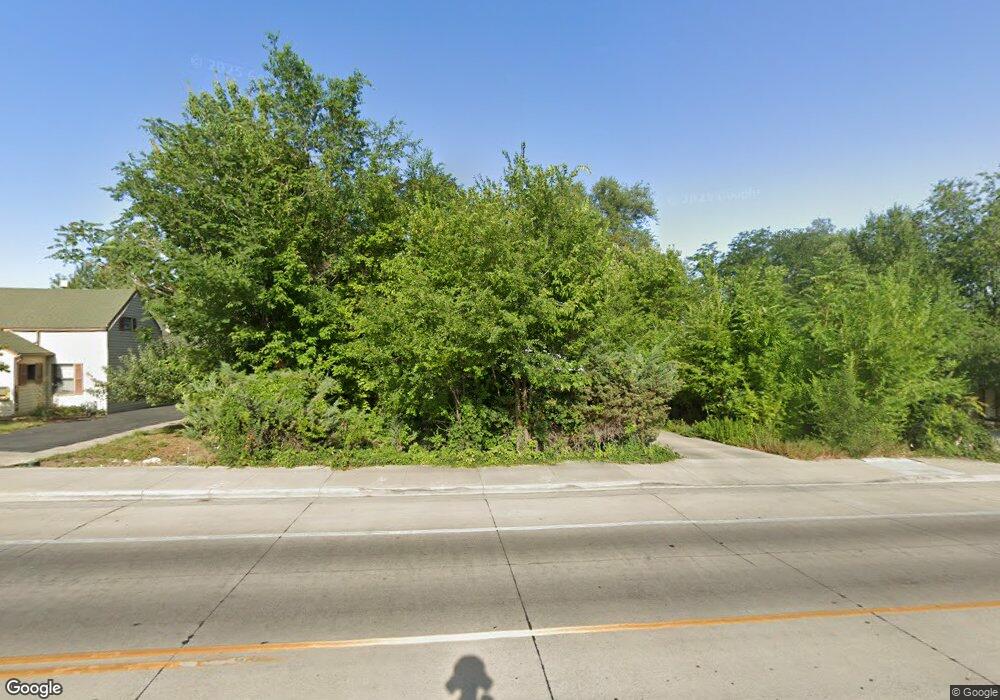
597 N 400 E Bountiful, UT 84010
Estimated Value: $395,000 - $467,000
3
Beds
1
Bath
1,044
Sq Ft
$406/Sq Ft
Est. Value
About This Home
This home is located at 597 N 400 E, Bountiful, UT 84010 and is currently estimated at $423,712, approximately $405 per square foot. 597 N 400 E is a home located in Davis County with nearby schools including Tolman School, Bountiful Junior High School, and Viewmont High School.
Ownership History
Date
Name
Owned For
Owner Type
Purchase Details
Closed on
Dec 10, 2020
Sold by
Miller Kendall A and Miller Nathan K
Bought by
Miller Kendall A and Miller Nathan K
Current Estimated Value
Home Financials for this Owner
Home Financials are based on the most recent Mortgage that was taken out on this home.
Original Mortgage
$107,832
Outstanding Balance
$95,955
Interest Rate
2.8%
Mortgage Type
New Conventional
Estimated Equity
$327,757
Purchase Details
Closed on
Nov 23, 2010
Sold by
Bessey Lyn A and Brimhall Leslie A
Bought by
Miller Kendall A and Miller Nathan K
Home Financials for this Owner
Home Financials are based on the most recent Mortgage that was taken out on this home.
Original Mortgage
$136,353
Interest Rate
4.37%
Mortgage Type
FHA
Purchase Details
Closed on
Mar 6, 2009
Sold by
Amundsen Helen C
Bought by
Bessey Lyn A and Brimhall Leslie A
Create a Home Valuation Report for This Property
The Home Valuation Report is an in-depth analysis detailing your home's value as well as a comparison with similar homes in the area
Purchase History
| Date | Buyer | Sale Price | Title Company |
|---|---|---|---|
| Miller Kendall A | -- | Vanguard Title Ins | |
| Miller Kendall A | -- | Inwest Title Services Inc | |
| Bessey Lyn A | -- | None Available |
Source: Public Records
Mortgage History
| Date | Status | Borrower | Loan Amount |
|---|---|---|---|
| Open | Miller Kendall A | $107,832 | |
| Closed | Miller Kendall A | $136,353 |
Source: Public Records
Tax History
| Year | Tax Paid | Tax Assessment Tax Assessment Total Assessment is a certain percentage of the fair market value that is determined by local assessors to be the total taxable value of land and additions on the property. | Land | Improvement |
|---|---|---|---|---|
| 2025 | $2,546 | $190,300 | $112,073 | $78,227 |
| 2024 | $2,289 | $184,250 | $99,525 | $84,725 |
| 2023 | $2,212 | $322,000 | $183,359 | $138,641 |
| 2022 | $2,335 | $181,500 | $100,192 | $81,308 |
| 2021 | $1,947 | $261,000 | $131,114 | $129,886 |
| 2020 | $1,794 | $214,000 | $111,996 | $102,004 |
| 2019 | $1,763 | $217,000 | $118,251 | $98,749 |
| 2018 | $1,572 | $195,000 | $114,961 | $80,039 |
| 2016 | $1,298 | $85,140 | $48,096 | $37,044 |
| 2015 | $1,266 | $78,045 | $48,096 | $29,949 |
| 2014 | $1,377 | $89,453 | $48,096 | $41,357 |
| 2013 | -- | $77,865 | $43,945 | $33,920 |
Source: Public Records
Map
Nearby Homes
- 513 N 400 E Unit 14B
- 453 N 400 E Unit 7-D
- 978 N 170 E
- 17 E 400 N Unit 19B
- 214 E 1250 N
- 683 E 100 N
- 49 E 200 N Unit 4
- 41 E 200 N Unit 6
- 55 E 200 N Unit 2
- 51 E 200 N Unit 3
- 256 N Main St
- 254 N Main St
- 252 N Main St
- 129 N 800 E
- 106 W 700 N
- 1420 N Main St
- 6 N 800 E
- 698 E 200 S
- 320 N 200 W Unit 4
- 499 N 200 W Unit 30
Your Personal Tour Guide
Ask me questions while you tour the home.