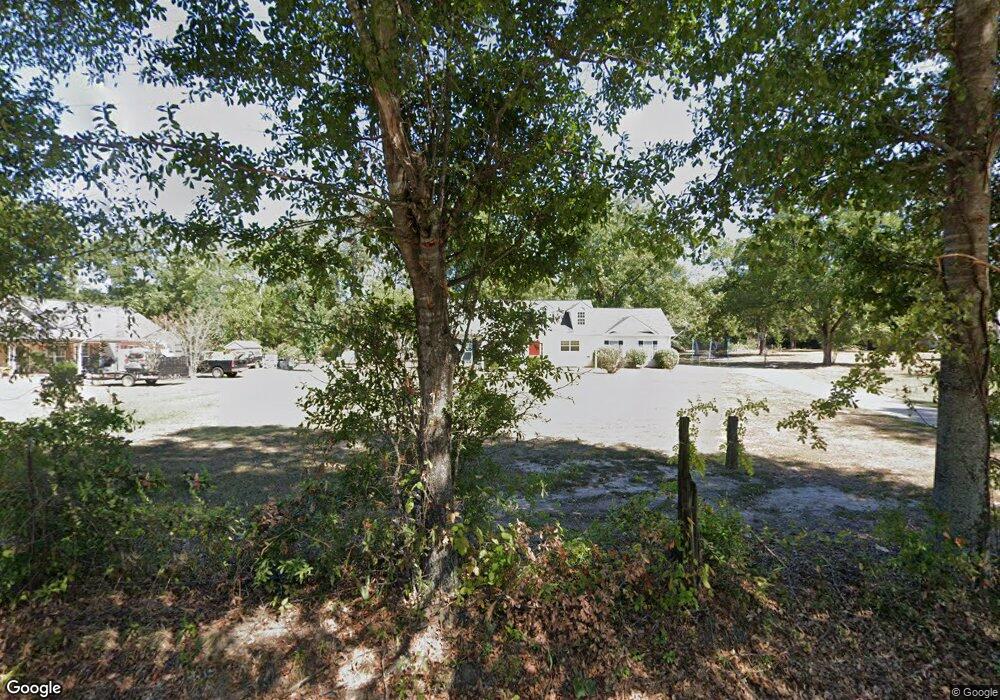
597 Old Milner Rd Barnesville, GA 30204
Estimated Value: $255,000 - $302,000
3
Beds
2
Baths
1,382
Sq Ft
$204/Sq Ft
Est. Value
About This Home
This home is located at 597 Old Milner Rd, Barnesville, GA 30204 and is currently estimated at $282,613, approximately $204 per square foot. 597 Old Milner Rd is a home located in Lamar County with nearby schools including Lamar County Primary School, Lamar County Elementary School, and Lamar County Middle School.
Ownership History
Date
Name
Owned For
Owner Type
Purchase Details
Closed on
Oct 5, 2016
Sold by
Joseph
Bought by
Pilkenton Properties Llc
Current Estimated Value
Purchase Details
Closed on
Feb 26, 2009
Sold by
Brown Patrick
Bought by
Murray G Niles
Purchase Details
Closed on
Jun 30, 2006
Sold by
Pilkenton Construction Inc
Bought by
Brown Patrick
Purchase Details
Closed on
Sep 22, 2005
Sold by
Davis Carlton H
Bought by
Pilkenton Jeffery
Purchase Details
Closed on
Nov 11, 2004
Sold by
Davis Carlton H and Williams Mix
Bought by
Davis Carlton H
Purchase Details
Closed on
Nov 24, 2002
Sold by
Henry Garnett
Bought by
Davis Carlton H and Williams Mixon
Purchase Details
Closed on
Oct 8, 2002
Sold by
Davis and Mixon
Bought by
Henry Garnett
Create a Home Valuation Report for This Property
The Home Valuation Report is an in-depth analysis detailing your home's value as well as a comparison with similar homes in the area
Home Values in the Area
Average Home Value in this Area
Purchase History
| Date | Buyer | Sale Price | Title Company |
|---|---|---|---|
| Pilkenton Properties Llc | -- | -- | |
| Murray G Niles | -- | -- | |
| Murray G Niles | -- | -- | |
| Brown Patrick | $136,500 | -- | |
| Pilkenton Jeffery | $60,000 | -- | |
| Davis Carlton H | -- | -- | |
| Davis Carlton H | -- | -- | |
| Henry Garnett | $106,000 | -- |
Source: Public Records
Tax History Compared to Growth
Tax History
| Year | Tax Paid | Tax Assessment Tax Assessment Total Assessment is a certain percentage of the fair market value that is determined by local assessors to be the total taxable value of land and additions on the property. | Land | Improvement |
|---|---|---|---|---|
| 2025 | $2,044 | $95,907 | $5,995 | $89,912 |
| 2024 | $2,044 | $79,863 | $5,995 | $73,868 |
| 2023 | $2,066 | $74,829 | $5,995 | $68,834 |
| 2022 | $1,822 | $66,013 | $4,196 | $61,817 |
| 2021 | $1,560 | $51,878 | $3,271 | $48,607 |
| 2020 | $1,558 | $49,229 | $3,271 | $45,958 |
| 2019 | $1,293 | $40,733 | $3,271 | $37,462 |
| 2018 | $1,241 | $40,733 | $3,271 | $37,462 |
| 2017 | $1,235 | $40,733 | $3,271 | $37,462 |
| 2016 | $1,235 | $40,733 | $3,271 | $37,462 |
| 2015 | $1,233 | $40,733 | $3,271 | $37,462 |
| 2014 | $1,328 | $45,262 | $7,800 | $37,462 |
| 2013 | -- | $45,261 | $7,800 | $37,461 |
Source: Public Records
Map
Nearby Homes
- 113 Heatherwood Ln
- 704 Old Milner Rd
- 0 Main St Unit 10586668
- 0 Main St Unit 10585681
- 130 Catalpa Rd
- 126 Catalpa Rd
- 135 Catalpa Rd
- 138 Catalpa Rd
- 841 Old Milner Rd
- 587 Highway 41 N
- 0 Silver Dollar Rd Unit 10552561
- 0 Piedmont Rd Unit 10600733
- 116 Moore St
- 0 Wilson Rd Unit 10564610
- 171 Meadowbrooke Dr
- 129 Magnolia Trail
- 127 Magnolia Trail
- 603 Silver Dollar Rd
- V L Silver Dollar Rd
- 105 Zebulon St
- 603 Old Milner Rd
- 591 Old Milner Rd
- 296 Fellowship Dr
- 290 Fellowship Dr
- 583 Old Milner Rd
- 284 Fellowship Dr
- 581 Old Milner Rd
- 777 Old Milner Rd
- 759 Old Milner Rd
- 278 Fellowship Dr
- 289 Fellowship Dr Unit 8
- 289 Fellowship Dr
- 272 Fellowship Dr
- 388 Industrial Rd
- 388 Industrial Rd
- 264 Fellowship Dr
- 277 Fellowship Dr
- 561 Old Milner Rd
- 265 Fellowship Dr
- 258 Fellowship Dr