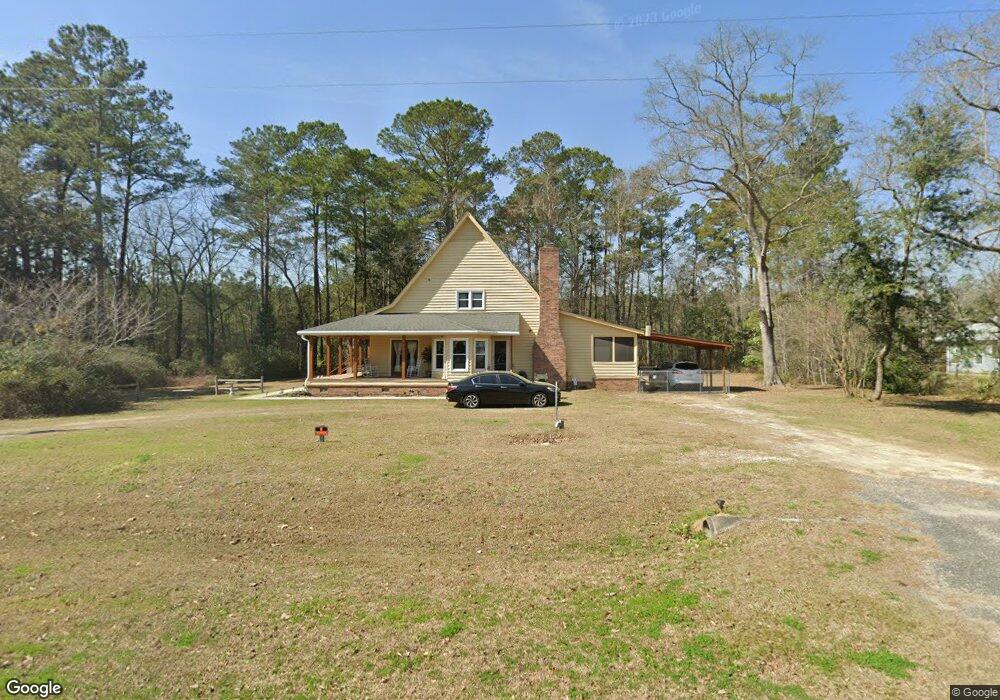
597 Tillman Branch Rd Summerville, SC 29483
Estimated Value: $290,149 - $399,000
--
Bed
--
Bath
1,796
Sq Ft
$180/Sq Ft
Est. Value
About This Home
This home is located at 597 Tillman Branch Rd, Summerville, SC 29483 and is currently estimated at $322,787, approximately $179 per square foot. 597 Tillman Branch Rd is a home located in Berkeley County with nearby schools including Carolyn Lewis School, Cane Bay Middle School, and Cane Bay High School.
Ownership History
Date
Name
Owned For
Owner Type
Purchase Details
Closed on
Mar 23, 2023
Sold by
Hebert Kimberly C
Bought by
Brunson Kimberly C and Brunson Robert A
Current Estimated Value
Purchase Details
Closed on
Apr 8, 2015
Sold by
Maurice John Wesley and Maurice Janice M
Bought by
Smith Andrew I
Purchase Details
Closed on
Aug 4, 2008
Sold by
Hebert Andre R
Bought by
Hebert Kimberly C
Home Financials for this Owner
Home Financials are based on the most recent Mortgage that was taken out on this home.
Original Mortgage
$93,000
Interest Rate
6.31%
Mortgage Type
New Conventional
Purchase Details
Closed on
Sep 21, 2004
Sold by
Maurice John Wesley and Maurice Janice M
Bought by
Hebert Andre R and Hebert Kimberly C
Purchase Details
Closed on
Aug 31, 2004
Sold by
Mizell Vivian Jane D and Mizzell Vivian Jane D
Bought by
Mizell Vivian Jane D and Hill Kathy M
Create a Home Valuation Report for This Property
The Home Valuation Report is an in-depth analysis detailing your home's value as well as a comparison with similar homes in the area
Home Values in the Area
Average Home Value in this Area
Purchase History
| Date | Buyer | Sale Price | Title Company |
|---|---|---|---|
| Brunson Kimberly C | -- | -- | |
| Smith Andrew I | $42,000 | -- | |
| Hebert Kimberly C | -- | -- | |
| Hebert Andre R | $155,000 | -- | |
| Mizell Vivian Jane D | -- | -- |
Source: Public Records
Mortgage History
| Date | Status | Borrower | Loan Amount |
|---|---|---|---|
| Previous Owner | Hebert Kimberly C | $93,000 |
Source: Public Records
Tax History Compared to Growth
Tax History
| Year | Tax Paid | Tax Assessment Tax Assessment Total Assessment is a certain percentage of the fair market value that is determined by local assessors to be the total taxable value of land and additions on the property. | Land | Improvement |
|---|---|---|---|---|
| 2025 | $3,114 | $203,930 | $37,319 | $166,611 |
| 2024 | $3,114 | $8,157 | $1,493 | $6,664 |
| 2023 | $3,114 | $12,236 | $2,239 | $9,997 |
| 2022 | $754 | $7,094 | $1,770 | $5,324 |
| 2021 | $770 | $7,090 | $1,770 | $5,324 |
| 2020 | $778 | $7,094 | $1,770 | $5,324 |
| 2019 | $773 | $7,094 | $1,770 | $5,324 |
| 2018 | $703 | $6,168 | $1,040 | $5,128 |
| 2017 | $623 | $6,168 | $1,040 | $5,128 |
| 2016 | $636 | $6,170 | $1,040 | $5,130 |
| 2015 | $593 | $6,170 | $1,040 | $5,130 |
| 2014 | $583 | $6,170 | $1,040 | $5,130 |
| 2013 | -- | $6,170 | $1,040 | $5,130 |
Source: Public Records
Map
Nearby Homes
- 0 Tillman Branch Rd Unit 25016941
- 510 Midway Ct
- 317 Lankford St
- 413 Peacock Ln
- 427 Grape Arbor Dr
- 1422 Alexander Cir
- 0 Peacock Ln Unit 25020832
- 617 Bridgewater Ct
- 315 Cantley Ct
- 248 Marshall Acres Dr
- 281 Decatur Dr
- 284 Decatur Dr
- 278 Decatur Dr
- 511 Stafford Springs Ct
- 000 Tullis St
- 118 Beacon Falls Ct
- 108 Beacon Falls Ct
- 190 Decatur Dr
- 111 Brookhaven Rd
- 396 Decatur Dr
- 00 Tillman Branch Rd
- 0 Tillman Branch Rd Unit 24008492
- 0 Tillman Branch Rd Unit 15004787
- 601 Tillman Branch Rd
- 594 Tillman Branch Rd
- 602 Tillman Branch Rd
- 607 Tillman Branch Rd
- 576 Tillman Branch Rd
- 567 Tillman Branch Rd
- 564 Tillman Branch Rd
- 543 Tillman Branch Rd
- 556 McCrystal Cir
- 552 McCrystal Cir
- 548 McCrystal Cir
- 560 McCrystal Cir
- 544 McCrystal Cir
- 564 McCrystal Cir
- 540 McCrystal Cir
- 568 McCrystal Cir
- 536 McCrystal Cir