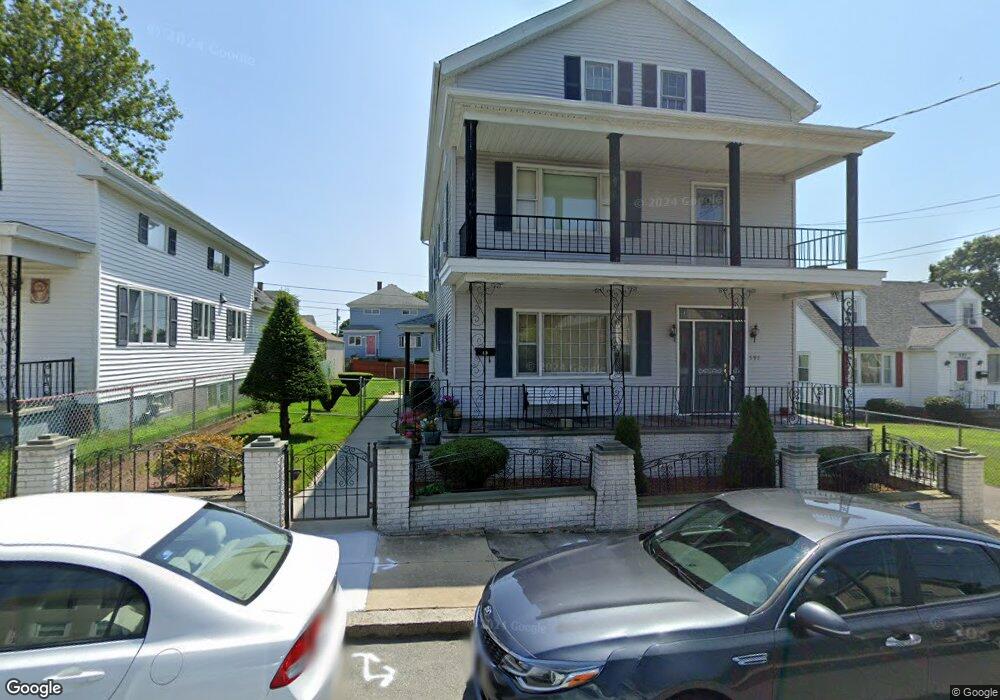
597 Tower St Fall River, MA 02721
Maplewood NeighborhoodEstimated Value: $505,628 - $614,000
4
Beds
2
Baths
3,182
Sq Ft
$175/Sq Ft
Est. Value
About This Home
This home is located at 597 Tower St, Fall River, MA 02721 and is currently estimated at $555,407, approximately $174 per square foot. 597 Tower St is a home located in Bristol County with nearby schools including Letourneau Elementary School, Matthew J. Kuss Middle School, and B M C Durfee High School.
Ownership History
Date
Name
Owned For
Owner Type
Purchase Details
Closed on
May 23, 2023
Sold by
Barbosa Margarida
Bought by
Melo Sandra B and Barbosa Ashley C
Current Estimated Value
Purchase Details
Closed on
May 16, 2023
Sold by
Barbosa Daniel R Est
Bought by
Barbosa Margarida
Purchase Details
Closed on
Oct 13, 1978
Bought by
Barbosa Daniel and Barbosa Margarida
Create a Home Valuation Report for This Property
The Home Valuation Report is an in-depth analysis detailing your home's value as well as a comparison with similar homes in the area
Home Values in the Area
Average Home Value in this Area
Purchase History
| Date | Buyer | Sale Price | Title Company |
|---|---|---|---|
| Melo Sandra B | -- | None Available | |
| Barbosa Margarida | -- | None Available | |
| Barbosa Daniel | $8,400 | -- |
Source: Public Records
Tax History
| Year | Tax Paid | Tax Assessment Tax Assessment Total Assessment is a certain percentage of the fair market value that is determined by local assessors to be the total taxable value of land and additions on the property. | Land | Improvement |
|---|---|---|---|---|
| 2025 | $5,091 | $444,600 | $116,300 | $328,300 |
| 2024 | $4,663 | $405,800 | $114,000 | $291,800 |
| 2023 | $4,344 | $354,000 | $102,700 | $251,300 |
| 2022 | $3,599 | $317,800 | $96,900 | $220,900 |
| 2021 | $3,599 | $260,200 | $92,600 | $167,600 |
| 2020 | $3,208 | $222,000 | $88,300 | $133,700 |
| 2019 | $3,139 | $215,300 | $92,300 | $123,000 |
| 2018 | $2,933 | $200,600 | $93,000 | $107,600 |
| 2017 | $2,722 | $194,400 | $93,000 | $101,400 |
| 2016 | $2,654 | $194,700 | $95,900 | $98,800 |
| 2015 | $2,675 | $204,500 | $95,900 | $108,600 |
| 2014 | $2,700 | $214,600 | $95,900 | $118,700 |
Source: Public Records
Map
Nearby Homes
Your Personal Tour Guide
Ask me questions while you tour the home.