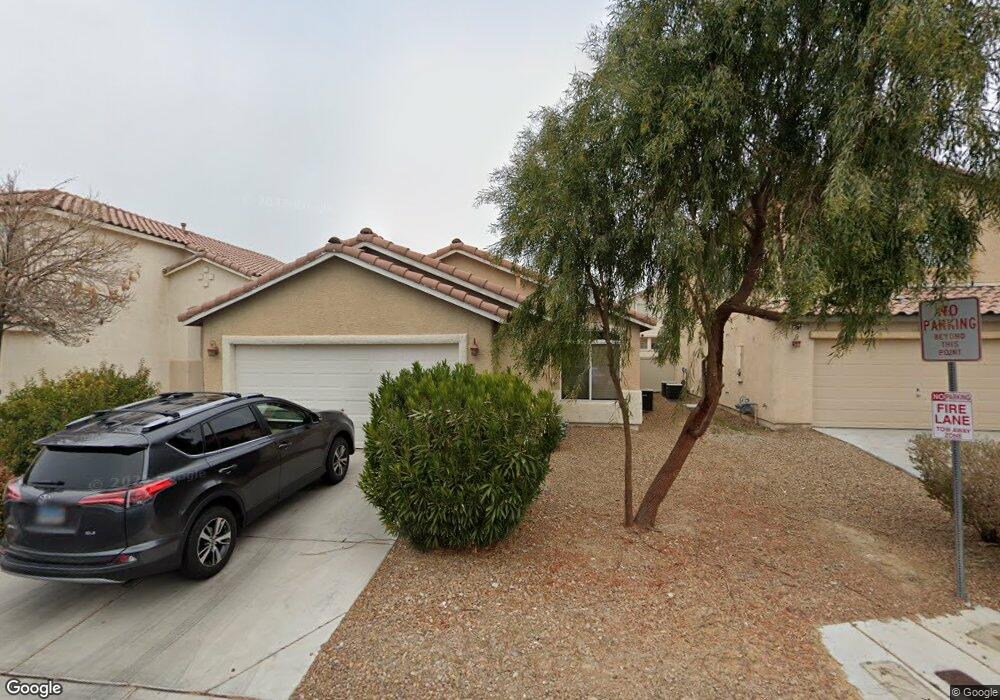
5970 Clover Canyon Ln Las Vegas, NV 89142
Estimated Value: $347,176 - $378,000
3
Beds
2
Baths
1,334
Sq Ft
$274/Sq Ft
Est. Value
About This Home
This home is located at 5970 Clover Canyon Ln, Las Vegas, NV 89142 and is currently estimated at $365,044, approximately $273 per square foot. 5970 Clover Canyon Ln is a home located in Clark County with nearby schools including John F. Mendoza Elementary School, Duane D. Keller Middle School, and Las Vegas High School.
Ownership History
Date
Name
Owned For
Owner Type
Purchase Details
Closed on
Aug 22, 2024
Sold by
Kumra Baldev
Bought by
Baldev K Kumra Living Trust and Kumra
Current Estimated Value
Purchase Details
Closed on
Jul 2, 2013
Sold by
Kumra Reena
Bought by
Kumra Baldev
Purchase Details
Closed on
Mar 4, 2010
Sold by
Akash Sehdev Trust
Bought by
Sehdev Akash and Kumra Baldev K
Purchase Details
Closed on
Aug 26, 2003
Sold by
Richmond American Homes Of Nevada Inc
Bought by
Sehdev Akash
Home Financials for this Owner
Home Financials are based on the most recent Mortgage that was taken out on this home.
Original Mortgage
$117,500
Interest Rate
5.6%
Mortgage Type
Unknown
Create a Home Valuation Report for This Property
The Home Valuation Report is an in-depth analysis detailing your home's value as well as a comparison with similar homes in the area
Home Values in the Area
Average Home Value in this Area
Purchase History
| Date | Buyer | Sale Price | Title Company |
|---|---|---|---|
| Baldev K Kumra Living Trust | -- | None Listed On Document | |
| Kumra Baldev | -- | Lawyers Title Of Nevada | |
| Kumra Baldev | -- | Lawyers Title Of Nevada | |
| Sehdev Akash | -- | None Available | |
| Akash Sehdev Trust | -- | None Available | |
| Sehdev Akash | $157,603 | First American Title Company |
Source: Public Records
Mortgage History
| Date | Status | Borrower | Loan Amount |
|---|---|---|---|
| Previous Owner | Sehdev Akash | $117,500 | |
| Closed | Sehdev Akash | $29,000 |
Source: Public Records
Tax History Compared to Growth
Tax History
| Year | Tax Paid | Tax Assessment Tax Assessment Total Assessment is a certain percentage of the fair market value that is determined by local assessors to be the total taxable value of land and additions on the property. | Land | Improvement |
|---|---|---|---|---|
| 2025 | $1,053 | $84,834 | $24,150 | $60,684 |
| 2024 | $1,023 | $84,834 | $24,150 | $60,684 |
| 2023 | $1,023 | $84,146 | $26,950 | $57,196 |
| 2022 | $993 | $75,694 | $23,450 | $52,244 |
| 2021 | $964 | $69,515 | $19,950 | $49,565 |
| 2020 | $933 | $69,067 | $19,950 | $49,117 |
| 2019 | $906 | $65,854 | $17,500 | $48,354 |
| 2018 | $880 | $59,106 | $12,600 | $46,506 |
| 2017 | $1,660 | $56,591 | $11,900 | $44,691 |
| 2016 | $834 | $44,056 | $8,400 | $35,656 |
| 2015 | $831 | $35,331 | $6,650 | $28,681 |
| 2014 | $806 | $26,646 | $5,250 | $21,396 |
Source: Public Records
Map
Nearby Homes
- 5926 Mahogany Mountain Dr
- 6105 E Sahara Ave Unit 35
- 6105 E Sahara Ave Unit 117
- 6105 E Sahara Ave Unit 166
- 6105 E Sahara Ave Unit 26
- 5857 Rainbow Bridge Dr
- 6028 Las Nubes Dr
- 5816 Glory Canyon Way
- 2711 Morning Break Ct
- 6080 Saint Petersburg Dr
- 2307 Tuscarora Ct
- 6170 E Sahara Ave Unit 1031
- 6170 E Sahara Ave Unit 1076
- 5714 Roundrock Dr
- 6223 E Sahara Ave Unit 137
- 6223 E Sahara Ave Unit 165
- 6223 E Sahara Ave Unit 167
- 6223 E Sahara Ave Unit 190
- 6223 E Sahara Ave Unit 81
- 2179 Raspberry Hill Rd
- 5976 Clover Canyon Ln
- 5964 Clover Canyon Ln
- 5958 Clover Canyon Ln
- 5969 Blue Grouse Trail
- 5975 Blue Grouse Trail
- 5963 Blue Grouse Trail
- 5952 Clover Canyon Ln
- 5957 Blue Grouse Trail
- 5981 Blue Grouse Trail
- 5971 Clover Canyon Ln
- 5965 Clover Canyon Ln
- 5977 Clover Canyon Ln
- 5983 Clover Canyon Ln
- 5951 Blue Grouse Trail
- 5946 Clover Canyon Ln
- 5959 Clover Canyon Ln
- 5953 Clover Canyon Ln
- 5945 Blue Grouse Trail
- 5947 Clover Canyon Ln
- 5968 Blue Grouse Trail