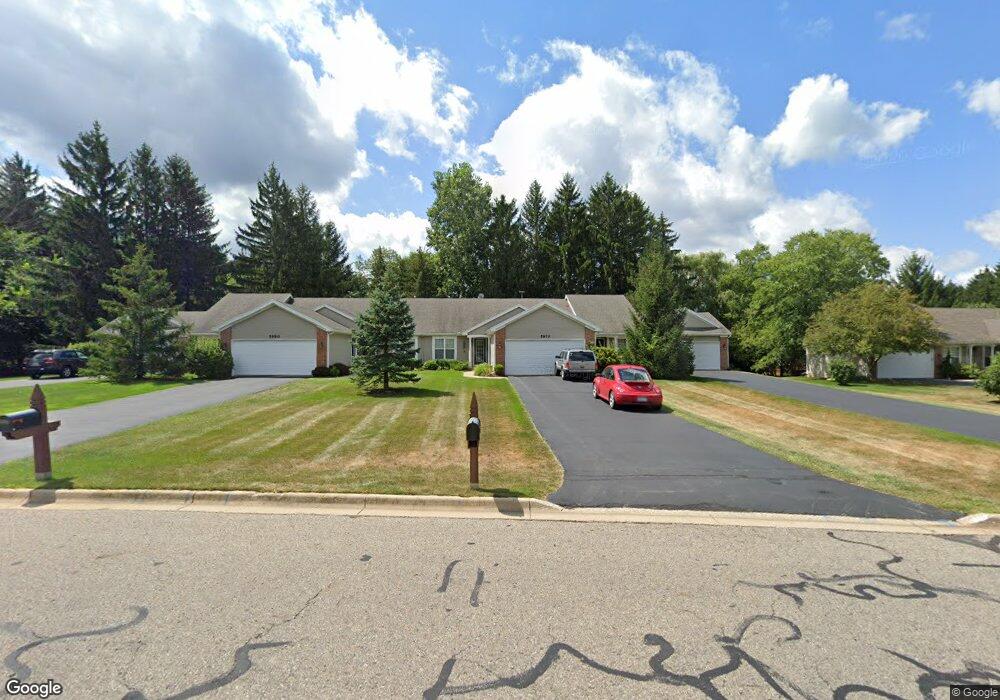
5970 Coleman Rd Unit 30 East Lansing, MI 48823
Estimated Value: $234,000 - $311,052
2
Beds
3
Baths
1,008
Sq Ft
$277/Sq Ft
Est. Value
About This Home
This home is located at 5970 Coleman Rd Unit 30, East Lansing, MI 48823 and is currently estimated at $279,013, approximately $276 per square foot. 5970 Coleman Rd Unit 30 is a home located in Clinton County with nearby schools including Haslett High School and St Thomas Aquinas School.
Ownership History
Date
Name
Owned For
Owner Type
Purchase Details
Closed on
Nov 8, 2024
Sold by
Lansing Farm Products Company and Lansing Farm Products
Bought by
Mccabe-Power Maureen
Current Estimated Value
Purchase Details
Closed on
Jun 12, 2009
Sold by
Homesales Inc
Bought by
Lansing Farm Products
Purchase Details
Closed on
Mar 11, 2009
Sold by
Federal National Mortgage Association
Bought by
Homesale Inc
Purchase Details
Closed on
Jul 10, 2008
Sold by
Jpmorgan Chase Bank Na
Bought by
Federal National Mortgage Association
Purchase Details
Closed on
Jun 26, 2008
Sold by
Klewicki Thomas E and Klewicki Eunice P
Bought by
Jpmorgan Chase Bank Na
Purchase Details
Closed on
Apr 14, 2008
Sold by
Jpmorgan Chase Bank Na
Bought by
Homesales Inc
Purchase Details
Closed on
Jan 31, 2008
Sold by
Klewicki Thomas E and Klewicki Eunice P
Bought by
Jpmorgan Chase Bank Na
Create a Home Valuation Report for This Property
The Home Valuation Report is an in-depth analysis detailing your home's value as well as a comparison with similar homes in the area
Home Values in the Area
Average Home Value in this Area
Purchase History
| Date | Buyer | Sale Price | Title Company |
|---|---|---|---|
| Mccabe-Power Maureen | $270,000 | Greater Lansing Title | |
| Lansing Farm Products | $95,000 | Heritage Title Services Llc | |
| Homesale Inc | -- | None Available | |
| Federal National Mortgage Association | -- | None Available | |
| Jpmorgan Chase Bank Na | $138,392 | None Available | |
| Homesales Inc | -- | None Available | |
| Jpmorgan Chase Bank Na | $16,989 | None Available |
Source: Public Records
Tax History Compared to Growth
Tax History
| Year | Tax Paid | Tax Assessment Tax Assessment Total Assessment is a certain percentage of the fair market value that is determined by local assessors to be the total taxable value of land and additions on the property. | Land | Improvement |
|---|---|---|---|---|
| 2025 | $5,151 | $137,900 | $22,000 | $115,900 |
| 2024 | $3,082 | $117,100 | $19,000 | $98,100 |
| 2023 | $2,931 | $108,700 | $0 | $0 |
| 2022 | $4,590 | $99,600 | $18,000 | $81,600 |
| 2021 | $4,466 | $96,200 | $18,000 | $78,200 |
| 2020 | $4,357 | $93,100 | $17,500 | $75,600 |
| 2019 | $4,203 | $87,000 | $17,500 | $69,500 |
| 2018 | $4,071 | $87,600 | $17,500 | $70,100 |
| 2017 | $3,992 | $84,100 | $17,500 | $66,600 |
| 2016 | $3,971 | $82,000 | $17,500 | $64,500 |
| 2015 | -- | $77,200 | $0 | $0 |
| 2011 | -- | $88,100 | $0 | $0 |
Source: Public Records
Map
Nearby Homes
- 5859 Printemp Dr Unit 9
- 16790 Printemp Dr Unit 5
- 6285 Heathfield Dr
- 16959 Kernwood Rd
- 6380 Heathfield Dr
- 6445 Pine Hollow Dr
- 2471 Overglen Ct
- 16975 Pine Hollow Dr
- 6381 Pine Hollow Dr
- 16673 Sundew Cir
- 6708 English Oak Dr
- 16931 Black Walnut Ln
- 0 English Oak Dr
- 6436 Culver Dr
- 6327 Skyline Dr
- 15507 Outer Dr
- 6097 Southridge Rd
- 6111 Fresno Ln
- 6101 Sleepy Hollow Ln
- 6120 Fresno Ln
- 5960 Coleman Rd
- 5980 Coleman Rd Unit 31
- 5950 Coleman Rd Unit 28
- 5990 Coleman Rd
- 5871 Printemp Dr
- 5875 Printemp Dr
- 5940 Coleman Rd
- 5879 Printemp Dr Unit 14
- 5930 Coleman Rd Unit 26
- 5867 Printemp Dr Unit 11
- 5883 Printemp Dr
- 5883 Printemp Dr Unit 15
- 5920 Coleman Rd Unit 25
- 5965 Coleman Rd Unit 35
- 5955 Coleman Rd Unit 36
- 5985 Coleman Rd Unit 34
- 5870 Printemp Dr Unit 31
- 5945 Coleman Rd Unit 37
- 5887 Printemp Dr Unit 16