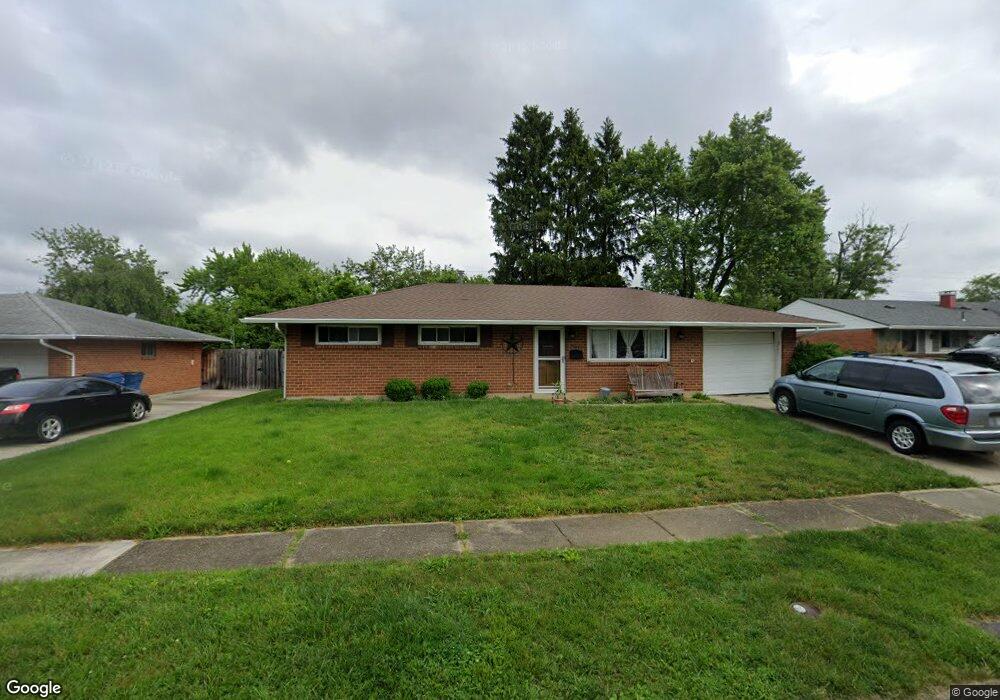
5971 Leycross Dr Dayton, OH 45424
Estimated Value: $165,000 - $212,000
3
Beds
2
Baths
1,464
Sq Ft
$136/Sq Ft
Est. Value
About This Home
This home is located at 5971 Leycross Dr, Dayton, OH 45424 and is currently estimated at $198,889, approximately $135 per square foot. 5971 Leycross Dr is a home located in Montgomery County with nearby schools including Wayne High School and Huber Heights Christian Academy.
Ownership History
Date
Name
Owned For
Owner Type
Purchase Details
Closed on
Sep 24, 2018
Sold by
Wallace Brian C and Williams Christina L
Bought by
Williams Christina L
Current Estimated Value
Home Financials for this Owner
Home Financials are based on the most recent Mortgage that was taken out on this home.
Original Mortgage
$74,800
Outstanding Balance
$65,230
Interest Rate
4.5%
Mortgage Type
New Conventional
Estimated Equity
$133,659
Purchase Details
Closed on
Apr 11, 2007
Sold by
Mcgrath Diane M
Bought by
Wallace Brian C and Williams Christina L
Purchase Details
Closed on
May 9, 2003
Sold by
Pohl Richard J and Pohl Patricia L
Bought by
Mcgrath Diane M
Home Financials for this Owner
Home Financials are based on the most recent Mortgage that was taken out on this home.
Original Mortgage
$99,114
Interest Rate
6.02%
Mortgage Type
FHA
Create a Home Valuation Report for This Property
The Home Valuation Report is an in-depth analysis detailing your home's value as well as a comparison with similar homes in the area
Home Values in the Area
Average Home Value in this Area
Purchase History
| Date | Buyer | Sale Price | Title Company |
|---|---|---|---|
| Williams Christina L | -- | Servicelink | |
| Wallace Brian C | $86,000 | Attorney | |
| Mcgrath Diane M | $99,900 | -- |
Source: Public Records
Mortgage History
| Date | Status | Borrower | Loan Amount |
|---|---|---|---|
| Open | Williams Christina L | $74,800 | |
| Previous Owner | Mcgrath Diane M | $99,114 |
Source: Public Records
Tax History Compared to Growth
Tax History
| Year | Tax Paid | Tax Assessment Tax Assessment Total Assessment is a certain percentage of the fair market value that is determined by local assessors to be the total taxable value of land and additions on the property. | Land | Improvement |
|---|---|---|---|---|
| 2024 | $2,790 | $54,070 | $10,150 | $43,920 |
| 2023 | $2,790 | $54,070 | $10,150 | $43,920 |
| 2022 | $2,488 | $37,250 | $7,000 | $30,250 |
| 2021 | $2,527 | $37,250 | $7,000 | $30,250 |
| 2020 | $2,529 | $37,250 | $7,000 | $30,250 |
| 2019 | $2,433 | $31,640 | $7,000 | $24,640 |
| 2018 | $2,441 | $31,640 | $7,000 | $24,640 |
| 2017 | $2,372 | $31,640 | $7,000 | $24,640 |
| 2016 | $2,249 | $29,210 | $7,000 | $22,210 |
| 2015 | $2,220 | $29,210 | $7,000 | $22,210 |
| 2014 | $2,220 | $29,210 | $7,000 | $22,210 |
| 2012 | -- | $31,520 | $8,750 | $22,770 |
Source: Public Records
Map
Nearby Homes
- 7126 Mandrake Dr
- 6800 Cicero Ct
- 6673 Celestine St
- 6529 Harshmanville Rd
- 6245 Longford Rd
- 7150 Harshmanville Rd
- 5926 Chambersburg Rd
- 5904 Troy Villa Blvd Unit 20051
- 6946 Hubbard Dr
- 6413 Alter Rd
- 6601 Grovehill Dr
- 5631 Longford Rd
- 7371 Damascus Dr
- 5625 Copley Cir
- 5873 Troy Villa Blvd Unit 20174
- 5637 Troy Villa Blvd Unit 20088
- 6717 Alter Rd
- 6447 Highbury Rd
- 5248 Tilbury Rd
- 6150 Taylorsville Rd
- 5963 Leycross Dr
- 5979 Leycross Dr
- 6076 Longford Rd
- 6084 Longford Rd
- 5955 Leycross Dr
- 6058 Longford Rd
- 6092 Longford Rd
- 5980 Leycross Dr
- 5972 Leycross Dr
- 6050 Longford Rd
- 5988 Leycross Dr
- 5964 Leycross Dr
- 5947 Leycross Dr
- 5956 Leycross Dr
- 6051 Longford Rd
- 6059 Longford Rd
- 6042 Longford Rd
- 6021 Leycross Dr
- 6067 Longford Rd
- 6108 Longford Rd