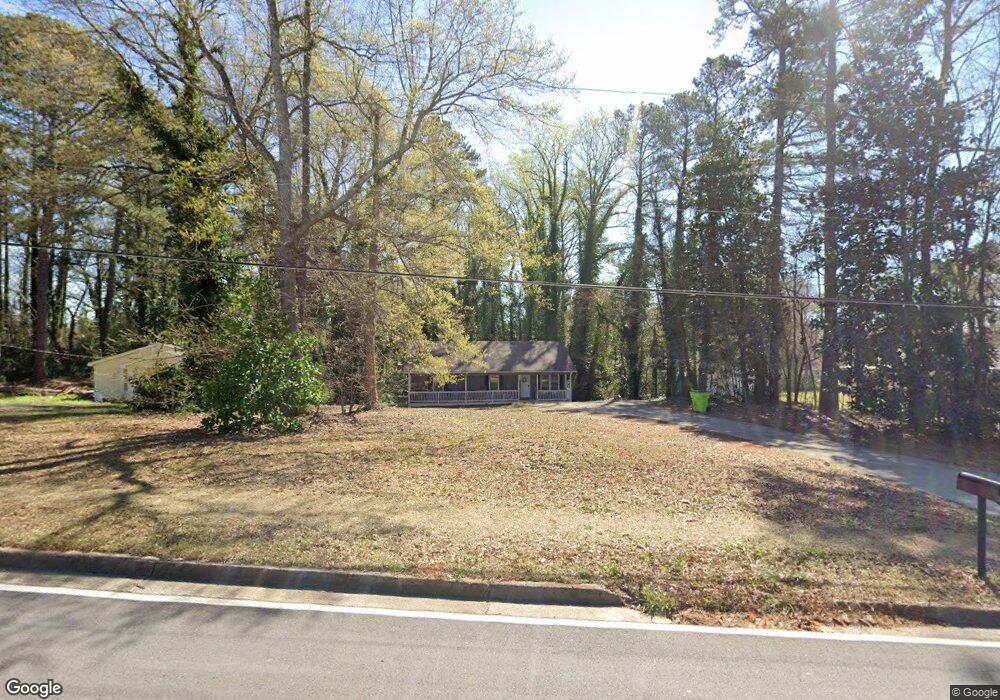
5971 S Gordon Rd Austell, GA 30168
Estimated Value: $231,742 - $253,000
3
Beds
2
Baths
1,144
Sq Ft
$211/Sq Ft
Est. Value
About This Home
This home is located at 5971 S Gordon Rd, Austell, GA 30168 and is currently estimated at $241,686, approximately $211 per square foot. 5971 S Gordon Rd is a home located in Cobb County with nearby schools including Mableton Elementary School, Garrett Middle School, and Pebblebrook High School.
Ownership History
Date
Name
Owned For
Owner Type
Purchase Details
Closed on
Jul 24, 2023
Sold by
Eph 2 Assets Llc
Bought by
Cbar Asset Company Llc
Current Estimated Value
Purchase Details
Closed on
May 19, 2023
Sold by
Vm Master Issuer Llc
Bought by
Eph 2 Assets Llc
Purchase Details
Closed on
Jun 2, 2022
Sold by
Vm Pronto Llc
Bought by
Vm Master Issuer Llc
Purchase Details
Closed on
Apr 26, 2014
Sold by
Harley Tim
Bought by
Harley Homes Llc
Purchase Details
Closed on
Jul 8, 2011
Sold by
Kolo Holding Llc
Bought by
Harley Tim and Haley Margaret
Purchase Details
Closed on
Jun 24, 2002
Sold by
Shuford Don L
Bought by
Shuford Paul
Home Financials for this Owner
Home Financials are based on the most recent Mortgage that was taken out on this home.
Original Mortgage
$92,000
Interest Rate
6.79%
Mortgage Type
New Conventional
Create a Home Valuation Report for This Property
The Home Valuation Report is an in-depth analysis detailing your home's value as well as a comparison with similar homes in the area
Home Values in the Area
Average Home Value in this Area
Purchase History
| Date | Buyer | Sale Price | Title Company |
|---|---|---|---|
| Cbar Asset Company Llc | $229,900 | None Listed On Document | |
| Eph 2 Assets Llc | $212,000 | None Listed On Document | |
| Vm Master Issuer Llc | $977,300 | Rosenberg Lpa Llc | |
| Harley Homes Llc | -- | -- | |
| Harley Tim | $55,000 | -- | |
| Shuford Paul | $115,800 | -- |
Source: Public Records
Mortgage History
| Date | Status | Borrower | Loan Amount |
|---|---|---|---|
| Previous Owner | Shuford Paul | $92,000 |
Source: Public Records
Tax History Compared to Growth
Tax History
| Year | Tax Paid | Tax Assessment Tax Assessment Total Assessment is a certain percentage of the fair market value that is determined by local assessors to be the total taxable value of land and additions on the property. | Land | Improvement |
|---|---|---|---|---|
| 2025 | $2,888 | $95,860 | $34,960 | $60,900 |
| 2024 | $2,890 | $95,860 | $34,960 | $60,900 |
| 2023 | $2,228 | $73,904 | $34,960 | $38,944 |
| 2022 | $1,744 | $57,452 | $22,080 | $35,372 |
| 2021 | $1,504 | $49,568 | $19,136 | $30,432 |
| 2020 | $1,370 | $45,152 | $14,720 | $30,432 |
| 2019 | $1,370 | $45,152 | $14,720 | $30,432 |
| 2018 | $1,121 | $36,944 | $8,464 | $28,480 |
| 2017 | $773 | $26,880 | $5,520 | $21,360 |
| 2016 | $773 | $26,880 | $5,520 | $21,360 |
| 2015 | $780 | $26,464 | $3,680 | $22,784 |
| 2014 | $704 | $23,696 | $0 | $0 |
Source: Public Records
Map
Nearby Homes
- 6084 S Gordon Rd
- 1984 Brenda Dr
- 1628 Pendley Dr
- 1995 Matt Dr
- 2023 Lee Dr
- 1582 Pine Cir
- 1995 Oak Ct
- 6083 Oak Hill Dr
- 2145 Venesa Cir
- 0 Dogwood Cir Unit 7671035
- 0 Dogwood Cir Unit 10630776
- 1550 Greenbrook Dr
- 1676 Veterans Memorial Hwy SW
- 1155 Elowen Dr
- 1055 Elowen Dr
- 2335 Ravencliff Dr
- 2335 Ravencliff Dr Unit 91
- 1397 Jewell Ct SW
- 2425 Ravencliff Dr Unit 88
- 2425 Ravencliff Dr
- 5971 S Gordon Rd
- 5961 S Gordon Rd
- 5991 S Gordon Rd
- 5960 S Gordon Rd
- 5966 Nathan Place
- 1841 Blossom Ln
- 5931 S Gordon Rd
- 5956 Nathan Place
- 5956 Nathan Place Unit 5956
- 5980 S Gordon Rd
- 5946 S Gordon Rd
- 1782 Blossom Ln
- 1811 Blossom Ln
- 1801 Witt Dr
- 1791 Blossom Ln
- LOT 2 Blossom Ln
- LOT 1 Blossom Ln
- 1831 Blossom Ln
- 5940 Nathan Place
- 1801 Blossom Ln