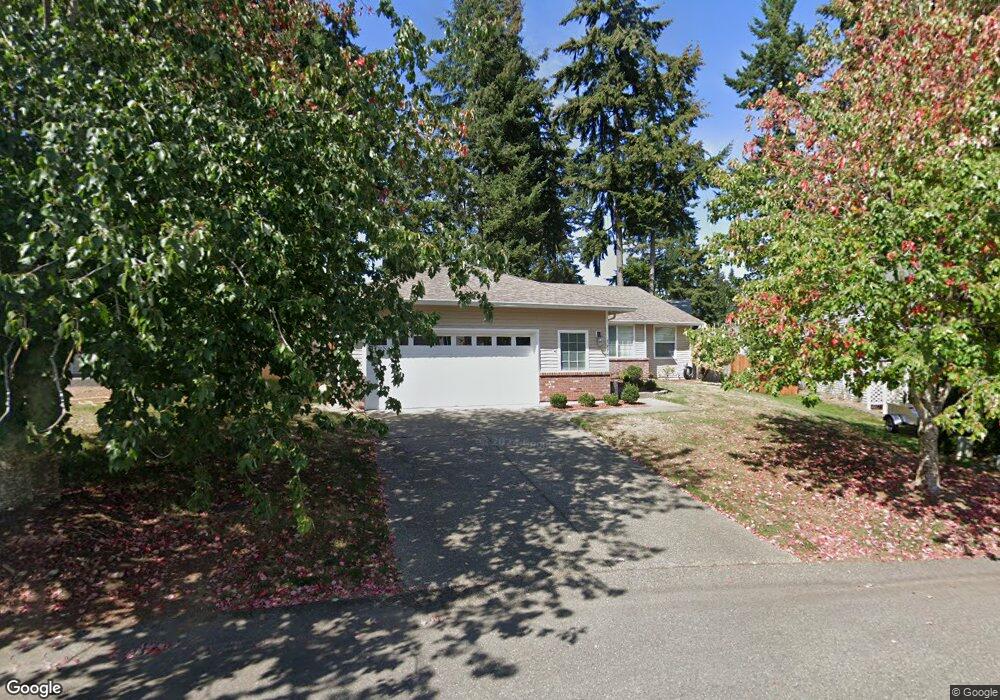
5971 Turley Loop Rd SE Port Orchard, WA 98366
East Port Orchard NeighborhoodEstimated Value: $465,000 - $489,000
3
Beds
2
Baths
1,488
Sq Ft
$320/Sq Ft
Est. Value
About This Home
This home is located at 5971 Turley Loop Rd SE, Port Orchard, WA 98366 and is currently estimated at $476,423, approximately $320 per square foot. 5971 Turley Loop Rd SE is a home located in Kitsap County with nearby schools including Hidden Creek Elementary School, Marcus Whitman Middle School, and South Kitsap High School.
Ownership History
Date
Name
Owned For
Owner Type
Purchase Details
Closed on
Feb 6, 2020
Sold by
Karpiak Michael
Bought by
Karpiak Michael and Karpiak Beverly G
Current Estimated Value
Home Financials for this Owner
Home Financials are based on the most recent Mortgage that was taken out on this home.
Original Mortgage
$265,000
Outstanding Balance
$233,599
Interest Rate
3.37%
Mortgage Type
New Conventional
Estimated Equity
$242,824
Purchase Details
Closed on
Feb 16, 2007
Sold by
Bessler Michael D and Bessler Cristina A
Bought by
Karpiak Michael
Home Financials for this Owner
Home Financials are based on the most recent Mortgage that was taken out on this home.
Original Mortgage
$178,000
Interest Rate
6.21%
Mortgage Type
Purchase Money Mortgage
Purchase Details
Closed on
May 21, 2003
Sold by
Capstone Homes Inc
Bought by
Bessler Michael D and Bessler Cristina A
Home Financials for this Owner
Home Financials are based on the most recent Mortgage that was taken out on this home.
Original Mortgage
$174,318
Interest Rate
5.75%
Mortgage Type
VA
Create a Home Valuation Report for This Property
The Home Valuation Report is an in-depth analysis detailing your home's value as well as a comparison with similar homes in the area
Home Values in the Area
Average Home Value in this Area
Purchase History
| Date | Buyer | Sale Price | Title Company |
|---|---|---|---|
| Karpiak Michael | -- | Fidelity National Title | |
| Karpiak Michael | $270,280 | Stewart Title Of Kitsap Co | |
| Bessler Michael D | $170,900 | Transnation Title Ins Co |
Source: Public Records
Mortgage History
| Date | Status | Borrower | Loan Amount |
|---|---|---|---|
| Open | Karpiak Michael | $265,000 | |
| Closed | Karpiak Michael | $178,000 | |
| Previous Owner | Bessler Michael D | $174,318 |
Source: Public Records
Tax History Compared to Growth
Tax History
| Year | Tax Paid | Tax Assessment Tax Assessment Total Assessment is a certain percentage of the fair market value that is determined by local assessors to be the total taxable value of land and additions on the property. | Land | Improvement |
|---|---|---|---|---|
| 2026 | $3,372 | $412,750 | $71,200 | $341,550 |
| 2025 | $3,372 | $381,090 | $61,720 | $319,370 |
| 2024 | $3,270 | $381,090 | $61,720 | $319,370 |
| 2023 | $3,248 | $381,090 | $61,720 | $319,370 |
| 2022 | $3,188 | $313,430 | $57,640 | $255,790 |
| 2021 | $3,085 | $287,180 | $53,560 | $233,620 |
| 2020 | $3,032 | $274,280 | $51,010 | $223,270 |
| 2019 | $2,681 | $266,030 | $50,080 | $215,950 |
| 2018 | $3,022 | $232,520 | $50,080 | $182,440 |
| 2017 | $2,576 | $232,520 | $50,080 | $182,440 |
| 2016 | $2,501 | $206,460 | $50,080 | $156,380 |
| 2015 | $2,419 | $202,340 | $50,080 | $152,260 |
| 2014 | -- | $198,230 | $50,080 | $148,150 |
| 2013 | -- | $191,260 | $52,720 | $138,540 |
Source: Public Records
Map
Nearby Homes
- 3157 SE Villa Carmel Dr
- 4541 Brame Ln SE
- 3258 SE Mahali Ln
- 3929 Briarwood Dr SE
- 2399 SE Sedgwick Rd
- 5184 Granada Place SE
- 0 SE Sedgwick Rd Unit NWM2332354
- 0 SE Sedgwick Rd Unit 21804061
- 2403 SE Converse Place
- 2314 SE Abernathy Ct
- 2426 SE Celebrity Ct
- 2430 SE Celebrity Ct
- 2315 SE Kelby Cir
- 1932 SE Salmonberry Rd
- 3628 Creek View Ct SE
- 1612 SE Sylvis Ln
- 1743 SE Crawford Rd
- 1632 SE Salmonberry Rd
- 5673 Bethel Rd SE Unit 28
- 1 SE Salmonberry Rd
- 5965 Turley Loop Rd SE
- 5983 Turley Loop SE
- 3180 SE Villa Carmel Dr
- 5959 Turley Loop Rd SE
- 5983 Turley Loop Rd SE
- 5954 Turley Loop Rd SE
- 3186 SE Villa Carmel Dr
- 6000 Turley Loop SE
- 6000 Turley Loop Rd SE
- 5953 Turley Loop Rd SE
- 3168 SE Villa Carmel Dr
- 5948 Turley Loop Rd SE
- 6006 Turley Loop Rd SE
- 5947 Turley Loop Rd SE
- 3164 SE Villa Carmel Dr
- 5995 Turley Loop SE
- 5995 Turley Loop Rd SE
- 5942 Turley Loop Rd SE