Estimated Value: $396,000 - $418,000
3
Beds
1
Bath
1,762
Sq Ft
$232/Sq Ft
Est. Value
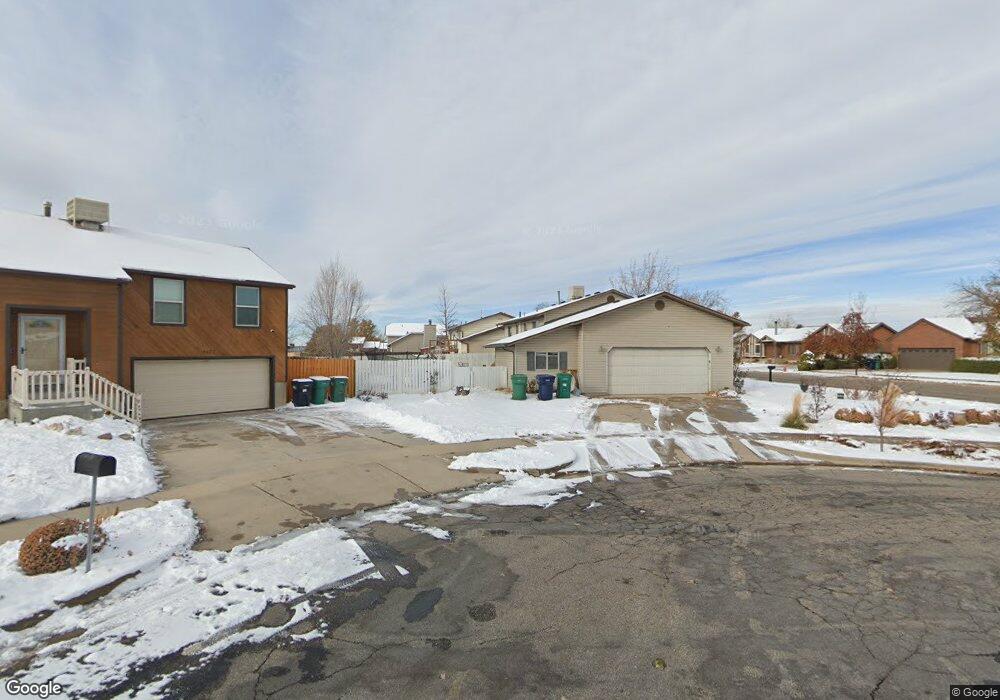
About This Home
This home is located at 5972 S 3975 W, Roy, UT 84067 and is currently estimated at $409,432, approximately $232 per square foot. 5972 S 3975 W is a home located in Weber County with nearby schools including Freedom School, Roy Junior High School, and Roy High School.
Ownership History
Date
Name
Owned For
Owner Type
Purchase Details
Closed on
Jul 3, 2019
Sold by
Delgiudice Sonia G
Bought by
Delgiudice Sonia G and Delgiudice Del Giudice
Current Estimated Value
Purchase Details
Closed on
Jul 17, 2006
Sold by
Delgiudice Sonia
Bought by
Delgiudice Sonia G
Home Financials for this Owner
Home Financials are based on the most recent Mortgage that was taken out on this home.
Original Mortgage
$15,000
Outstanding Balance
$8,866
Interest Rate
6.57%
Mortgage Type
Credit Line Revolving
Estimated Equity
$400,566
Purchase Details
Closed on
Nov 6, 2000
Sold by
Taylor T Michael and Taylor Allison Jean
Bought by
Delgiudice Sonia
Home Financials for this Owner
Home Financials are based on the most recent Mortgage that was taken out on this home.
Original Mortgage
$70,000
Outstanding Balance
$25,794
Interest Rate
7.88%
Estimated Equity
$383,638
Create a Home Valuation Report for This Property
The Home Valuation Report is an in-depth analysis detailing your home's value as well as a comparison with similar homes in the area
Home Values in the Area
Average Home Value in this Area
Purchase History
| Date | Buyer | Sale Price | Title Company |
|---|---|---|---|
| Delgiudice Sonia G | -- | None Available | |
| Delgiudice Sonia G | -- | Us Title Of Utah Ogden | |
| Delgiudice Sonia | -- | Associated Title |
Source: Public Records
Mortgage History
| Date | Status | Borrower | Loan Amount |
|---|---|---|---|
| Open | Delgiudice Sonia G | $15,000 | |
| Open | Delgiudice Sonia | $70,000 |
Source: Public Records
Tax History
| Year | Tax Paid | Tax Assessment Tax Assessment Total Assessment is a certain percentage of the fair market value that is determined by local assessors to be the total taxable value of land and additions on the property. | Land | Improvement |
|---|---|---|---|---|
| 2025 | $2,107 | $373,267 | $135,000 | $238,267 |
| 2024 | $2,040 | $200,199 | $74,257 | $125,942 |
| 2023 | $1,919 | $188,650 | $65,968 | $122,682 |
| 2022 | $2,164 | $216,700 | $60,501 | $156,199 |
| 2021 | $1,757 | $292,000 | $80,017 | $211,983 |
| 2020 | $1,472 | $224,000 | $80,017 | $143,983 |
| 2019 | $1,523 | $219,000 | $45,048 | $173,952 |
| 2018 | $1,331 | $181,000 | $39,924 | $141,076 |
| 2017 | $1,233 | $158,000 | $39,924 | $118,076 |
| 2016 | $1,176 | $81,268 | $21,415 | $59,853 |
| 2015 | $986 | $70,256 | $21,415 | $48,841 |
| 2014 | $991 | $69,813 | $18,611 | $51,202 |
Source: Public Records
Map
Nearby Homes
- 5856 S 3950 W
- 5773 S 3850 W
- 3826 W 5750 S
- 4264 W 6025 S
- 6052 S 4275 W
- 2216 W 2615 N Unit 142
- 4276 W 6025 S
- 2208 W 2615 N
- 2208 W 2615 N Unit 141
- 2186 W 2615 N
- 2186 W 2615 N Unit 139
- 3016 W 2650 N
- 3186 W 2600 N
- 2606 N 2125 W
- 2606 N 2125 W Unit 149
- 2602 N 2125 W
- 2602 N 2125 W Unit 150
- 3832 W 5625 S
- 2596 N 2125 W Unit 151
- 2596 N 2125 W
Your Personal Tour Guide
Ask me questions while you tour the home.