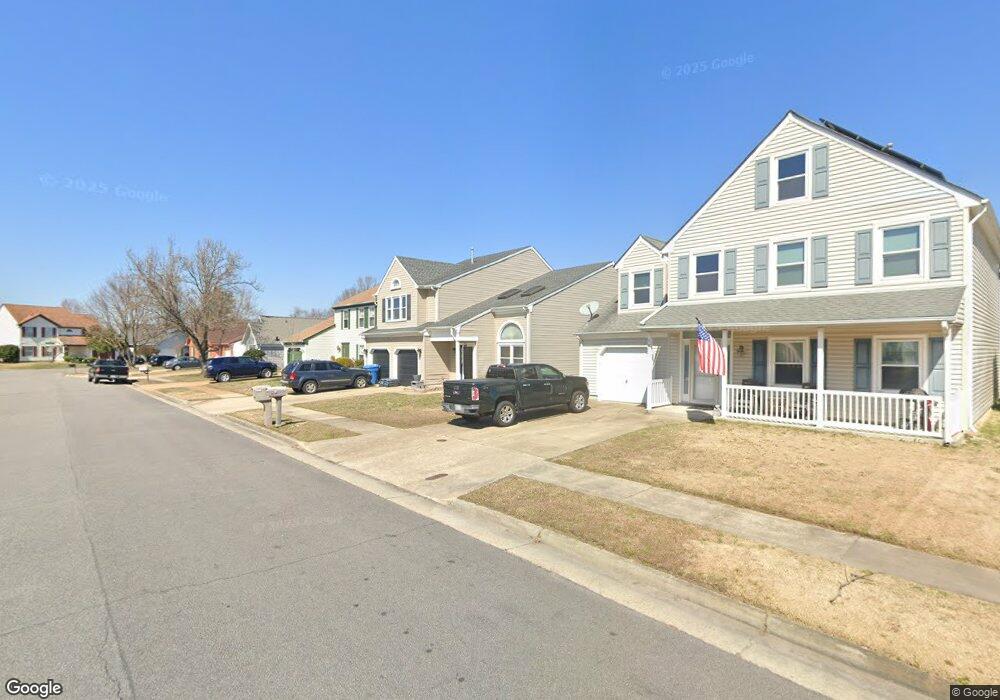
5973 Glen View Dr Virginia Beach, VA 23464
Estimated Value: $416,000 - $451,000
4
Beds
3
Baths
2,115
Sq Ft
$206/Sq Ft
Est. Value
About This Home
This home is located at 5973 Glen View Dr, Virginia Beach, VA 23464 and is currently estimated at $436,374, approximately $206 per square foot. 5973 Glen View Dr is a home located in Virginia Beach City with nearby schools including Centerville Elementary, Brandon Middle School, and Tallwood High School.
Ownership History
Date
Name
Owned For
Owner Type
Purchase Details
Closed on
Jun 10, 2019
Sold by
Santos Gomer and Santos Paulyn
Bought by
Grant Billy R
Current Estimated Value
Home Financials for this Owner
Home Financials are based on the most recent Mortgage that was taken out on this home.
Original Mortgage
$306,450
Outstanding Balance
$269,444
Interest Rate
4.1%
Mortgage Type
VA
Estimated Equity
$166,930
Purchase Details
Closed on
Sep 27, 2006
Sold by
Sprague Elenita P
Bought by
Santos Gomer
Home Financials for this Owner
Home Financials are based on the most recent Mortgage that was taken out on this home.
Original Mortgage
$237,600
Interest Rate
6.49%
Mortgage Type
New Conventional
Purchase Details
Closed on
May 24, 2002
Sold by
Anthony Robert
Bought by
Sprague Mark
Home Financials for this Owner
Home Financials are based on the most recent Mortgage that was taken out on this home.
Original Mortgage
$144,840
Interest Rate
7.01%
Mortgage Type
VA
Create a Home Valuation Report for This Property
The Home Valuation Report is an in-depth analysis detailing your home's value as well as a comparison with similar homes in the area
Home Values in the Area
Average Home Value in this Area
Purchase History
| Date | Buyer | Sale Price | Title Company |
|---|---|---|---|
| Grant Billy R | $300,000 | Advance Title & Abstract Inc | |
| Santos Gomer | $297,000 | -- | |
| Sprague Mark | $142,000 | -- |
Source: Public Records
Mortgage History
| Date | Status | Borrower | Loan Amount |
|---|---|---|---|
| Open | Grant Billy R | $306,450 | |
| Previous Owner | Santos Gomer | $237,600 | |
| Previous Owner | Sprague Mark | $144,840 |
Source: Public Records
Tax History Compared to Growth
Tax History
| Year | Tax Paid | Tax Assessment Tax Assessment Total Assessment is a certain percentage of the fair market value that is determined by local assessors to be the total taxable value of land and additions on the property. | Land | Improvement |
|---|---|---|---|---|
| 2025 | $3,793 | $406,200 | $157,500 | $248,700 |
| 2024 | $3,793 | $391,000 | $150,000 | $241,000 |
| 2023 | $3,627 | $366,400 | $135,000 | $231,400 |
| 2022 | $3,353 | $338,700 | $115,000 | $223,700 |
| 2021 | $2,919 | $294,800 | $94,000 | $200,800 |
| 2020 | $2,890 | $284,000 | $84,000 | $200,000 |
| 2019 | $2,737 | $269,000 | $80,000 | $189,000 |
| 2018 | $2,697 | $269,000 | $80,000 | $189,000 |
| 2017 | $2,552 | $254,600 | $75,000 | $179,600 |
| 2016 | $2,489 | $251,400 | $75,000 | $176,400 |
| 2015 | $2,328 | $235,200 | $74,800 | $160,400 |
| 2014 | $2,186 | $239,400 | $88,000 | $151,400 |
Source: Public Records
Map
Nearby Homes
- 1307 Plantation Lakes Cir
- 1821 Volvo Pkwy
- 1419 Birch Leaf Rd
- 5928 Chain Bridge Rd
- 1916 Shady Cove Ct
- 661 Crestfield Dr
- 640 Crestfield Dr
- 1065 Messa Loop
- 1061 Messa Loop
- 1067 Messa Loop
- 1063 Messa Loop
- 2037 Tyersal Dr
- 645 Crestfield Dr
- 637 Crestfield Dr
- 649 Crestfield Dr
- 2033 Tyersal Dr
- 621 Crestfield Dr
- 609 Crestfield Dr
- 2008 Gassett Ct
- MM Roseleigh
- 5977 Glen View Dr
- 5969 Glen View Dr
- 5965 Glen View Dr
- 5981 Glen View Dr
- 2109 Brandy Station Ct
- 5905 Cold Harbor Ct
- 5909 Cold Harbor Ct
- 5961 Glen View Dr
- 5968 Glen View Dr
- 2105 Brandy Station Ct
- 5985 Glen View Dr
- 5901 Cold Harbor Ct
- 5976 Glen View Dr
- 5980 Glen View Dr
- 5972 Glen View Dr
- 5913 Cold Harbor Ct
- 5984 Glen View Dr
- 2101 Brandy Station Ct
- 5988 Glen View Dr
- 5952 Glen View Dr