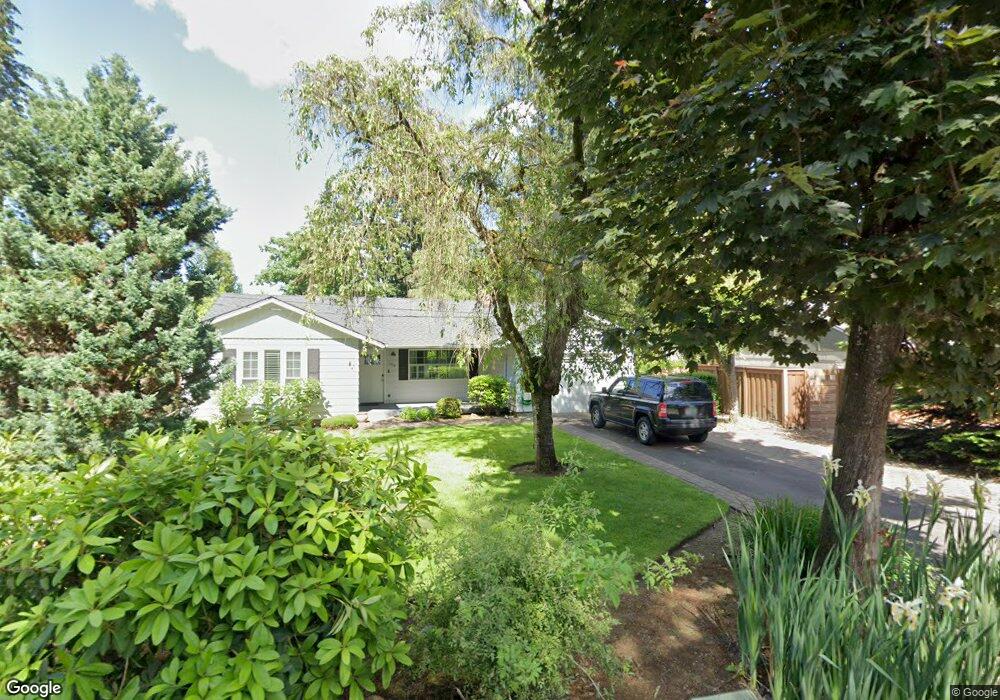
5973 SW Kennycroft Way Lake Oswego, OR 97035
Rosewood NeighborhoodEstimated Value: $577,517 - $699,000
3
Beds
6
Baths
1,202
Sq Ft
$532/Sq Ft
Est. Value
About This Home
This home is located at 5973 SW Kennycroft Way, Lake Oswego, OR 97035 and is currently estimated at $639,879, approximately $532 per square foot. 5973 SW Kennycroft Way is a home located in Clackamas County with nearby schools including River Grove Elementary School, Lakeridge Middle School, and Lakeridge High School.
Ownership History
Date
Name
Owned For
Owner Type
Purchase Details
Closed on
Feb 17, 2017
Sold by
Trusheim Michael and Trusheim Debra
Bought by
Trusheim Michael J and Trusheim Debra L
Current Estimated Value
Purchase Details
Closed on
Feb 23, 2011
Sold by
Powell Karen A
Bought by
Trusheim Michael and Trusheim Debra
Purchase Details
Closed on
Jul 20, 2001
Sold by
Dodson Rebecca S
Bought by
Powell Karen A
Home Financials for this Owner
Home Financials are based on the most recent Mortgage that was taken out on this home.
Original Mortgage
$122,800
Interest Rate
7.15%
Purchase Details
Closed on
Jun 30, 1999
Sold by
Quiett Robert W and Quiett Aloha G
Bought by
Dodson Rebecca S
Home Financials for this Owner
Home Financials are based on the most recent Mortgage that was taken out on this home.
Original Mortgage
$116,000
Interest Rate
7.24%
Create a Home Valuation Report for This Property
The Home Valuation Report is an in-depth analysis detailing your home's value as well as a comparison with similar homes in the area
Home Values in the Area
Average Home Value in this Area
Purchase History
| Date | Buyer | Sale Price | Title Company |
|---|---|---|---|
| Trusheim Michael J | -- | None Available | |
| Trusheim Michael | $282,950 | Wfg Title | |
| Powell Karen A | $153,500 | Oregon Title Insurance Co | |
| Dodson Rebecca S | $145,000 | Ticor Title Insurance |
Source: Public Records
Mortgage History
| Date | Status | Borrower | Loan Amount |
|---|---|---|---|
| Previous Owner | Powell Karen A | $122,800 | |
| Previous Owner | Dodson Rebecca S | $116,000 |
Source: Public Records
Tax History Compared to Growth
Tax History
| Year | Tax Paid | Tax Assessment Tax Assessment Total Assessment is a certain percentage of the fair market value that is determined by local assessors to be the total taxable value of land and additions on the property. | Land | Improvement |
|---|---|---|---|---|
| 2025 | $4,370 | $251,734 | -- | -- |
| 2024 | $4,256 | $244,402 | -- | -- |
| 2023 | $4,256 | $237,284 | $0 | $0 |
| 2022 | $4,015 | $230,373 | $0 | $0 |
| 2021 | $3,680 | $223,664 | $0 | $0 |
| 2020 | $3,587 | $217,150 | $0 | $0 |
| 2019 | $3,500 | $210,826 | $0 | $0 |
| 2018 | $3,366 | $204,685 | $0 | $0 |
| 2017 | $3,244 | $198,723 | $0 | $0 |
| 2016 | $2,923 | $192,935 | $0 | $0 |
| 2015 | $2,814 | $187,316 | $0 | $0 |
| 2014 | $3,209 | $181,860 | $0 | $0 |
Source: Public Records
Map
Nearby Homes
- 17928 Royal Ct
- 6050 Fernbrook St
- 5513 Rachel Ln
- 18411 Longfellow Ave
- 5225 Jean Rd Unit 307
- 19060 Terry Ave
- 6375 SW Dawn St
- 17239 Rebecca Ln
- 19222 Benfield Ave
- 6244 Frost Ln
- 5328 Lower Dr
- 16901 Kara Ln
- 5189 Rosewood St
- 18978 Arrowwood Ave
- 18434 Sandpiper Cir
- 18863 Indian Springs Rd
- 19368 Riverwood Ln
- 16508 Bonaire Ave
- 4401 Cobb Way
- 16524 SW Deer Terrace
- 5973 Kennycroft Way
- 5973 SW Kennycroft Waypvrm
- 5951 Kennycroft Way
- 5925 Kennycroft Way
- 5870 Lakeview Ct
- 5998 Kennycroft Way
- 5852 Lakeview Ct
- 5877 Kennycroft Way
- 5970 Kennycroft Way
- 5859 Kennycroft Way
- 5836 Lakeview Ct
- 5365 Lakeview Ct
- 5916 Kennycroft Way
- 5934 Kennycroft Way
- 5958 Kennycroft Way
- 6040 Lakeview Blvd
- 5882 SW Kennycroft Way
- 5833 Kennycroft Way
- 5882 Kennycroft Way
- 5824 Lakeview Ct