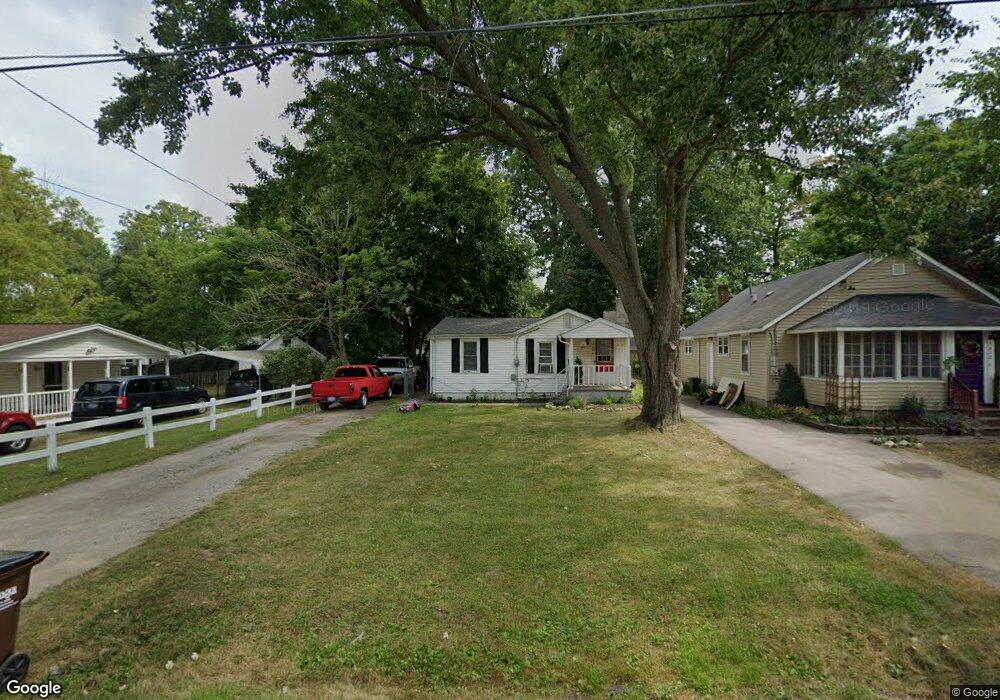
5974 Cypress St Haslett, MI 48840
Estimated Value: $115,000 - $154,000
2
Beds
1
Bath
964
Sq Ft
$136/Sq Ft
Est. Value
About This Home
This home is located at 5974 Cypress St, Haslett, MI 48840 and is currently estimated at $131,439, approximately $136 per square foot. 5974 Cypress St is a home located in Ingham County with nearby schools including Haslett High School and St Thomas Aquinas School.
Ownership History
Date
Name
Owned For
Owner Type
Purchase Details
Closed on
May 4, 2009
Sold by
Jpmorgan Chase Bank National Association
Bought by
Federal National Mortgage Association
Current Estimated Value
Purchase Details
Closed on
Oct 30, 2008
Sold by
Wicker Ashley J T
Bought by
Jpmorgan Chase Bank National Association and Washington Mutual Bank
Purchase Details
Closed on
Jul 17, 2006
Sold by
Anderson Harold E and Varney Betty
Bought by
Wicker Ashley J T
Home Financials for this Owner
Home Financials are based on the most recent Mortgage that was taken out on this home.
Original Mortgage
$86,400
Interest Rate
9.92%
Mortgage Type
Purchase Money Mortgage
Purchase Details
Closed on
Apr 1, 1992
Bought by
Anderson
Purchase Details
Closed on
Jun 1, 1986
Create a Home Valuation Report for This Property
The Home Valuation Report is an in-depth analysis detailing your home's value as well as a comparison with similar homes in the area
Home Values in the Area
Average Home Value in this Area
Purchase History
| Date | Buyer | Sale Price | Title Company |
|---|---|---|---|
| Federal National Mortgage Association | -- | None Available | |
| Jpmorgan Chase Bank National Association | $110,944 | None Available | |
| Wicker Ashley J T | $96,000 | Landamerica Transnation Titl | |
| Anderson | $36,900 | -- | |
| -- | $31,100 | -- |
Source: Public Records
Mortgage History
| Date | Status | Borrower | Loan Amount |
|---|---|---|---|
| Previous Owner | Wicker Ashley J T | $86,400 |
Source: Public Records
Tax History Compared to Growth
Tax History
| Year | Tax Paid | Tax Assessment Tax Assessment Total Assessment is a certain percentage of the fair market value that is determined by local assessors to be the total taxable value of land and additions on the property. | Land | Improvement |
|---|---|---|---|---|
| 2025 | $2,114 | $49,600 | $10,100 | $39,500 |
| 2024 | $10 | $46,300 | $9,600 | $36,700 |
| 2023 | $2,083 | $40,000 | $9,500 | $30,500 |
| 2022 | $2,019 | $36,500 | $8,900 | $27,600 |
| 2021 | $1,917 | $34,400 | $8,800 | $25,600 |
| 2020 | $1,875 | $31,500 | $8,800 | $22,700 |
| 2019 | $1,824 | $29,100 | $8,300 | $20,800 |
| 2018 | $1,704 | $26,200 | $9,600 | $16,600 |
| 2017 | $1,670 | $26,300 | $10,400 | $15,900 |
| 2016 | $743 | $23,800 | $10,000 | $13,800 |
| 2015 | $743 | $22,800 | $17,000 | $5,800 |
| 2014 | $743 | $22,600 | $17,000 | $5,600 |
Source: Public Records
Map
Nearby Homes
- 5989 Cypress St
- 5906 Marsh Rd
- Lot A Lake Lansing Rd
- Lot B Lake Lansing Rd
- 6248 W Reynolds Rd
- 1922 Lac Du Mont Unit 3
- 5837 Carlton St
- 6325 W Lake Dr
- 2037 Lac Du Mont Unit 41
- 1827 Towner Rd
- 6370 Royal Oak Dr
- 5953 Village Dr
- 6427 W Reynolds Rd
- 6403 E Reynolds Rd
- 5581 Woodville Rd
- 5808 Okemos Rd Unit 38
- 6120 Fresno Ln
- 7822 Forestview Dr
- 16925 Willowbrook Dr
- 6111 Fresno Ln