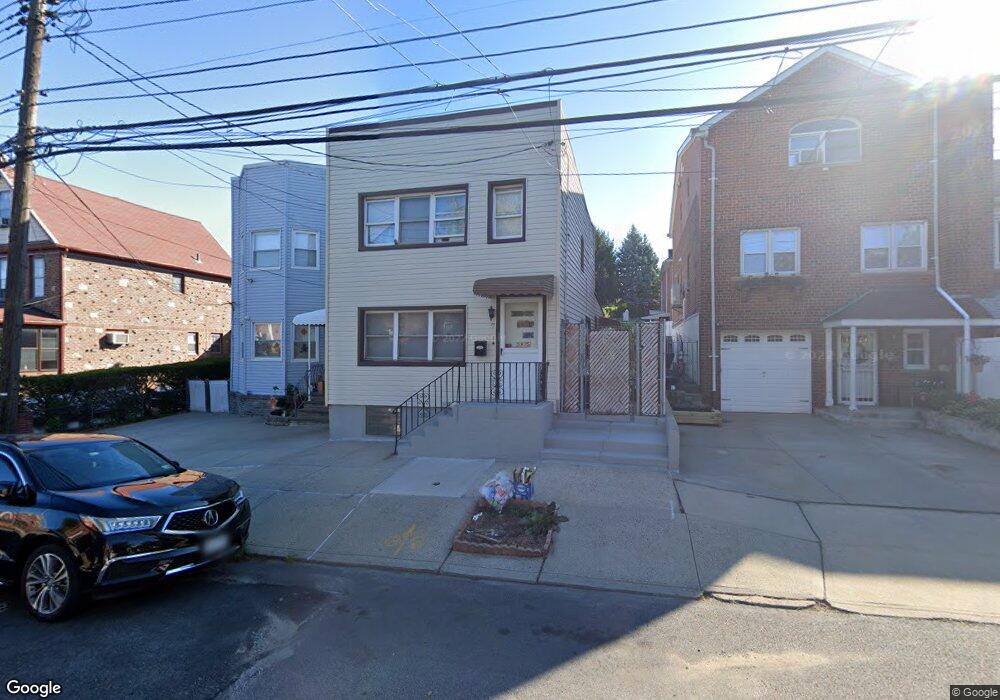
5975 60th St Maspeth, NY 11378
Maspeth NeighborhoodEstimated Value: $737,000 - $986,000
Studio
--
Bath
1,086
Sq Ft
$762/Sq Ft
Est. Value
About This Home
This home is located at 5975 60th St, Maspeth, NY 11378 and is currently estimated at $827,981, approximately $762 per square foot. 5975 60th St is a home located in Queens County with nearby schools including P.S. 153 Maspeth, IS 73 - The Frank Sansivieri School, and Grover Cleveland High School.
Ownership History
Date
Name
Owned For
Owner Type
Purchase Details
Closed on
Oct 6, 2020
Sold by
Jin Qiao Qing
Bought by
Jin Baofa and Lin Xiaomao
Current Estimated Value
Home Financials for this Owner
Home Financials are based on the most recent Mortgage that was taken out on this home.
Original Mortgage
$350,000
Outstanding Balance
$305,712
Interest Rate
2.8%
Mortgage Type
New Conventional
Estimated Equity
$522,269
Purchase Details
Closed on
Jul 30, 2019
Sold by
Philip Bonacchi As Trustee and The Living Trust Of Philip Bonacchi
Bought by
Jin Qiao Qing
Purchase Details
Closed on
Jun 18, 2004
Sold by
Bonacchi Surviving Tenant Philip and Bonacchi Rose
Bought by
Bonacchi Trustee Philip and Bonacchi Living Trust Of Philip
Purchase Details
Closed on
Feb 17, 1994
Sold by
Bonacchi Rose
Bought by
Bonacchi Rose
Create a Home Valuation Report for This Property
The Home Valuation Report is an in-depth analysis detailing your home's value as well as a comparison with similar homes in the area
Home Values in the Area
Average Home Value in this Area
Purchase History
We collect this data history from publicly available records. To have your information removed, we recommend requesting removal directly through your county’s website.
| Date | Buyer | Sale Price | Title Company |
|---|---|---|---|
| Jin Baofa | $650,000 | -- | |
| Jin Baofa | $650,000 | -- | |
| Jin Qiao Qing | $500,000 | -- | |
| Jin Qiao Qing | $500,000 | -- | |
| Bonacchi Trustee Philip | -- | -- | |
| Bonacchi Trustee Philip | -- | -- | |
| Bonacchi Rose | -- | Security Title & Guaranty Co | |
| Bonacchi Rose | -- | Security Title & Guaranty Co |
Source: Public Records
Mortgage History
We collect this data history from publicly available records. To have your information removed, we recommend requesting removal directly through your county’s website.
| Date | Status | Borrower | Loan Amount |
|---|---|---|---|
| Open | Jin Baofa | $350,000 | |
| Closed | Jin Baofa | $350,000 |
Source: Public Records
Tax History
| Year | Tax Paid | Tax Assessment Tax Assessment Total Assessment is a certain percentage of the fair market value that is determined by local assessors to be the total taxable value of land and additions on the property. | Land | Improvement |
|---|---|---|---|---|
| 2026 | $5,073 | $25,280 | $5,150 | $20,130 |
| 2025 | $4,922 | $25,259 | $6,191 | $19,068 |
| 2024 | $4,922 | $24,504 | $5,643 | $18,861 |
| 2023 | $4,663 | $23,216 | $5,340 | $17,876 |
| 2022 | $4,377 | $40,620 | $11,220 | $29,400 |
| 2021 | $4,434 | $42,660 | $11,220 | $31,440 |
| 2020 | $4,455 | $39,480 | $11,220 | $28,260 |
| 2019 | $4,272 | $43,500 | $11,220 | $32,280 |
| 2018 | $3,944 | $19,347 | $4,698 | $14,649 |
| 2017 | $3,724 | $18,270 | $6,079 | $12,191 |
| 2016 | $3,510 | $18,270 | $6,079 | $12,191 |
| 2015 | $1,859 | $17,541 | $7,966 | $9,575 |
| 2014 | $1,859 | $17,017 | $9,266 | $7,751 |
Source: Public Records
Map
Nearby Homes
- 60-14 60th Ave
- 60-27 60th St
- 6019 60th Dr
- 5918 60th St
- 60-58 60th Rd
- 5907 59th Dr
- 5940 Flushing Ave
- 58-22 60th Place
- 60-28 60th Place
- 60-66 60th St
- 6107 56th St
- 5869 59th St
- 58-29 60th Ln
- 6060 Flushing Ave
- 6062 Flushing Ave
- 61-82 56th St
- 60-85 55th St
- 5631 Metropolitan Ave
- 5912 58th Rd
- 5911 Fresh Pond Rd
Your Personal Tour Guide
Ask me questions while you tour the home.