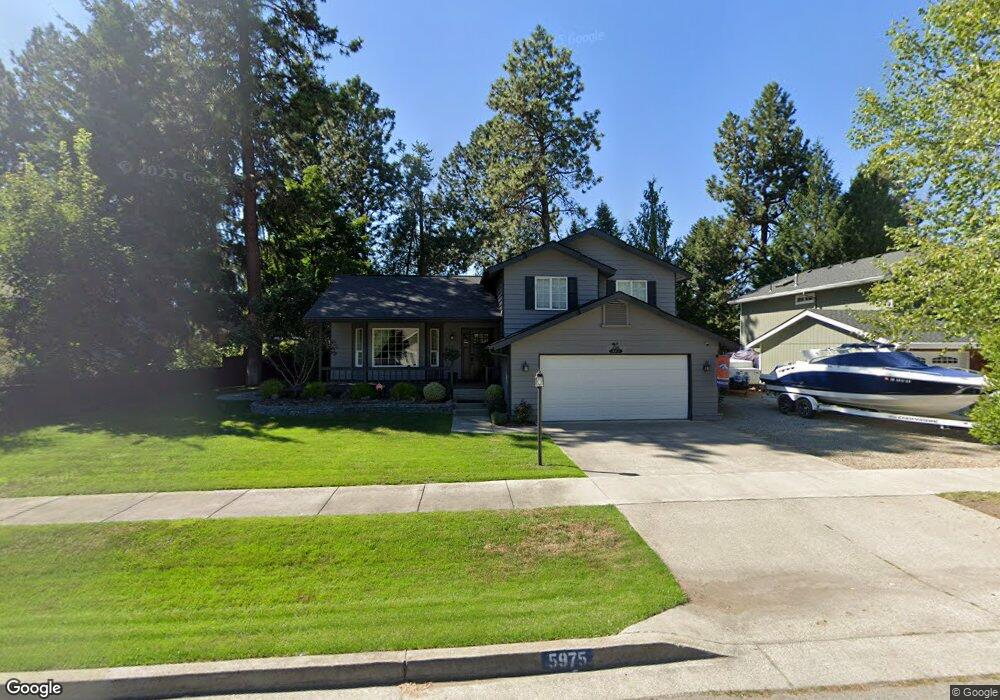
5975 N Christopher Dr Coeur D Alene, ID 83815
Ramsey-Woodland NeighborhoodEstimated Value: $536,000 - $558,000
3
Beds
3
Baths
1,860
Sq Ft
$293/Sq Ft
Est. Value
About This Home
This home is located at 5975 N Christopher Dr, Coeur D Alene, ID 83815 and is currently estimated at $544,934, approximately $292 per square foot. 5975 N Christopher Dr is a home located in Kootenai County with nearby schools including Winton Elementary School, Woodland Middle School, and Lake City High School.
Ownership History
Date
Name
Owned For
Owner Type
Purchase Details
Closed on
Jul 26, 2016
Sold by
Sanders Gregg and Sanders Mary M
Bought by
Sample Jeffrey L
Current Estimated Value
Home Financials for this Owner
Home Financials are based on the most recent Mortgage that was taken out on this home.
Original Mortgage
$220,924
Outstanding Balance
$180,874
Interest Rate
4.4%
Mortgage Type
FHA
Estimated Equity
$364,060
Purchase Details
Closed on
Jan 17, 2008
Sold by
Hsbc Bank Usa Na
Bought by
Sanders Mary M and Sanders Greg
Home Financials for this Owner
Home Financials are based on the most recent Mortgage that was taken out on this home.
Original Mortgage
$193,464
Interest Rate
6.09%
Mortgage Type
FHA
Purchase Details
Closed on
Jul 28, 2005
Sold by
Sauer Dianna
Bought by
Basile August R and Basile Carly A
Home Financials for this Owner
Home Financials are based on the most recent Mortgage that was taken out on this home.
Original Mortgage
$208,000
Interest Rate
6.11%
Mortgage Type
Adjustable Rate Mortgage/ARM
Create a Home Valuation Report for This Property
The Home Valuation Report is an in-depth analysis detailing your home's value as well as a comparison with similar homes in the area
Home Values in the Area
Average Home Value in this Area
Purchase History
| Date | Buyer | Sale Price | Title Company |
|---|---|---|---|
| Sample Jeffrey L | -- | Titleone Boise | |
| Sanders Mary M | -- | -- | |
| Basile August R | -- | -- |
Source: Public Records
Mortgage History
| Date | Status | Borrower | Loan Amount |
|---|---|---|---|
| Open | Sample Jeffrey L | $220,924 | |
| Previous Owner | Sanders Mary M | $193,464 | |
| Previous Owner | Basile August R | $208,000 |
Source: Public Records
Tax History Compared to Growth
Tax History
| Year | Tax Paid | Tax Assessment Tax Assessment Total Assessment is a certain percentage of the fair market value that is determined by local assessors to be the total taxable value of land and additions on the property. | Land | Improvement |
|---|---|---|---|---|
| 2025 | $1,844 | $512,600 | $190,000 | $322,600 |
| 2024 | $1,844 | $492,520 | $180,000 | $312,520 |
| 2023 | $1,844 | $516,271 | $185,000 | $331,271 |
| 2022 | $2,351 | $565,648 | $200,000 | $365,648 |
| 2021 | $2,202 | $377,365 | $120,000 | $257,365 |
| 2020 | $1,904 | $311,607 | $96,000 | $215,607 |
| 2019 | $1,919 | $275,552 | $96,096 | $179,456 |
| 2018 | $1,754 | $242,720 | $87,360 | $155,360 |
| 2017 | $1,561 | $215,810 | $62,400 | $153,410 |
| 2016 | $1,597 | $207,410 | $62,400 | $145,010 |
| 2015 | $1,553 | $195,830 | $52,000 | $143,830 |
| 2013 | $1,234 | $151,840 | $35,000 | $116,840 |
Source: Public Records
Map
Nearby Homes
- 5723 N Christopher Dr
- 5936 N Pinegrove Dr
- 6106 N Parkwood Cir
- 6091 N Galewood Dr
- 863 W Willow Lake Loop
- 1233 W Sycamore Ave
- 5513 N Atlantic Dr
- 896 W Willow Lake Loop
- 6522 N Idlewood Dr
- 934 W Willow Lake Loop
- 1118 W Willow Lake Loop
- 1686 W Dartmouth Cir
- 1815 W Dartmouth Cir
- 1710 Westminster Ave
- 4838 W Cougar Cir
- 6740 N Spurwing Loop Unit 200
- 1615 W Marlborough Ave
- 1840 Westminster Ave
- 4995 N Tasman Dr
- 6800 N Spurwing Loop Unit 303
- 5953 N Christopher Dr
- 5997 N Christopher Dr
- 5968 N Isabella Ct
- 5968 N Isabella Ct
- 5931 N Christopher Dr
- 5990 N Isabella Ct
- 5990 N Christopher Dr
- 5946 N Isabella Ct
- 5968 N Christopher Dr
- 5946 N Christopher Dr
- 5909 N Christopher Dr
- 5924 N Isabella Ct
- 6012 N Christopher Dr
- 5997 Isabella Ct
- 5924 N Christopher Dr
- 5995 N Isabella Ct
- 5902 N Isabella Ct
- 1333 W Columbus Ave
- 5792 N Parkwood Cir
- 5902 N Christopher Dr