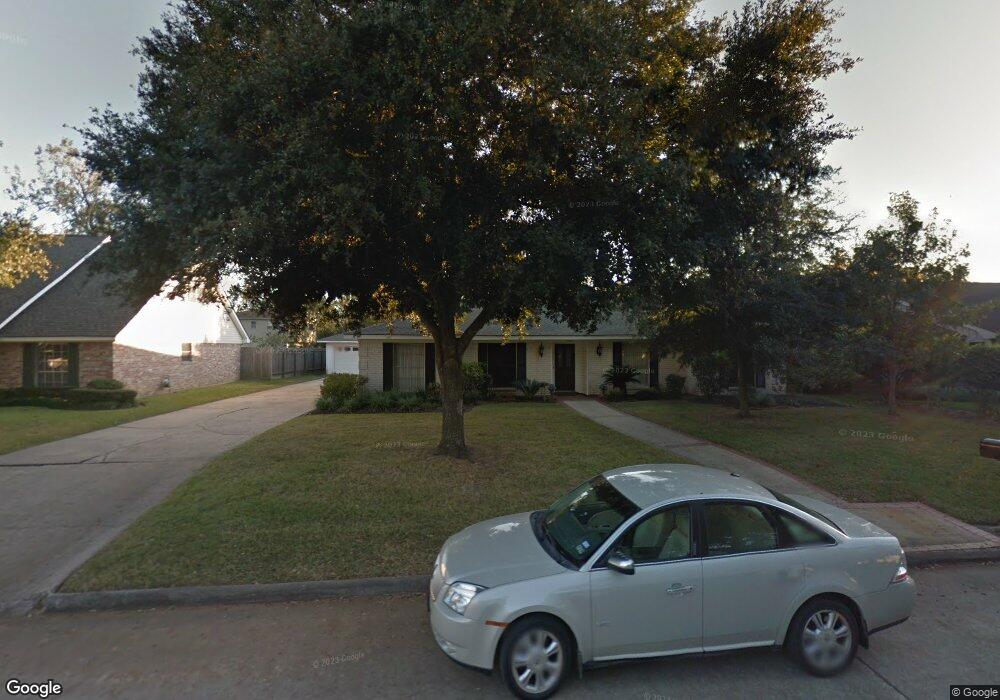
5975 Tangledahl Ln Beaumont, TX 77706
West End NeighborhoodEstimated Value: $273,564 - $303,000
4
Beds
3
Baths
2,420
Sq Ft
$121/Sq Ft
Est. Value
About This Home
This home is located at 5975 Tangledahl Ln, Beaumont, TX 77706 and is currently estimated at $291,641, approximately $120 per square foot. 5975 Tangledahl Ln is a home located in Jefferson County with nearby schools including Regina Howell Elementary School, Marshall Middle School, and West Brook Sr High School.
Ownership History
Date
Name
Owned For
Owner Type
Purchase Details
Closed on
Oct 2, 2023
Sold by
Gifford Baylee and Gifford Duane C
Bought by
Scheer Kellee
Current Estimated Value
Home Financials for this Owner
Home Financials are based on the most recent Mortgage that was taken out on this home.
Original Mortgage
$224,000
Outstanding Balance
$219,686
Interest Rate
7.23%
Mortgage Type
New Conventional
Estimated Equity
$71,955
Purchase Details
Closed on
Jun 30, 2020
Sold by
Baker Clarke E and Baker Katherine A
Bought by
Gifford Baylee and Gifford Duane C
Home Financials for this Owner
Home Financials are based on the most recent Mortgage that was taken out on this home.
Original Mortgage
$243,508
Interest Rate
3.2%
Mortgage Type
FHA
Purchase Details
Closed on
Sep 22, 2017
Sold by
Neill Iii John Patrick O and Hood Martha Elizbaeth
Bought by
Baker Clarke E and Baker Katherine A
Home Financials for this Owner
Home Financials are based on the most recent Mortgage that was taken out on this home.
Original Mortgage
$143,500
Interest Rate
3.89%
Mortgage Type
Stand Alone First
Purchase Details
Closed on
Feb 2, 2016
Sold by
Neill Mary Ann O
Bought by
Hood Martha Elizabeth and Neill Christopher Damian O
Create a Home Valuation Report for This Property
The Home Valuation Report is an in-depth analysis detailing your home's value as well as a comparison with similar homes in the area
Home Values in the Area
Average Home Value in this Area
Purchase History
| Date | Buyer | Sale Price | Title Company |
|---|---|---|---|
| Scheer Kellee | -- | Capital Title | |
| Gifford Baylee | -- | None Available | |
| Baker Clarke E | -- | None Available | |
| Hood Martha Elizabeth | -- | None Available |
Source: Public Records
Mortgage History
| Date | Status | Borrower | Loan Amount |
|---|---|---|---|
| Open | Scheer Kellee | $224,000 | |
| Previous Owner | Gifford Baylee | $243,508 | |
| Previous Owner | Baker Clarke E | $143,500 |
Source: Public Records
Tax History
| Year | Tax Paid | Tax Assessment Tax Assessment Total Assessment is a certain percentage of the fair market value that is determined by local assessors to be the total taxable value of land and additions on the property. | Land | Improvement |
|---|---|---|---|---|
| 2025 | $4,856 | $266,634 | $15,253 | $251,381 |
| 2024 | $4,856 | $266,634 | $15,253 | $251,381 |
| 2023 | $4,856 | $133,318 | $7,627 | $125,691 |
| 2022 | $3,221 | $123,263 | $7,627 | $115,636 |
| 2021 | $3,210 | $118,235 | $7,627 | $110,608 |
| 2020 | $5,054 | $209,500 | $15,253 | $194,247 |
| 2019 | $5,074 | $209,500 | $15,250 | $194,250 |
| 2018 | $5,219 | $210,100 | $15,250 | $194,850 |
| 2017 | $3,062 | $210,100 | $15,250 | $194,850 |
| 2016 | $5,348 | $194,510 | $15,250 | $179,260 |
Source: Public Records
Map
Nearby Homes
- 6025 Tangledahl Ln
- 6020 Pinkstaff Ln
- 5990 Pinkstaff Ln
- 6030 Zenith St
- 5885 Pinkstaff Ln
- 2060 Belvedere Dr
- 1550 Belvedere Dr
- 5910 Zenith St
- 0000 Savannah Trace
- 5755 Glasgow Ln
- 1535 Infinity Ln
- 1620 Wellington Place Unit 902
- 5725 Pickwick Ln
- 5715 Glasgow Ln
- 5530 Bellaire Ln
- 5710 Pickwick Ln
- 5755 Sul Ross Ln
- 1785 Rikisha Ln
- 1825 Rikisha Ln
- 1385 Howell St
- 5955 Tangledahl Ln
- 5995 Tangledahl Ln
- 5970 Pinkstaff Ln
- 5950 Pinkstaff Ln
- 5945 Tangledahl Ln
- 5970 Tangledahl Ln
- 5950 Tangledahl Ln
- 5990 Tangledahl Ln
- 5940 Pinkstaff Ln
- 5940 Tangledahl Ln
- 5925 Tangledahl Ln
- 5920 Pinkstaff Ln
- 6020 Tangledahl Ln
- 5975 Bicentennial Ln
- 5975 Pinkstaff Ln
- 5995 Bicentennial Ln
- 6045 Tangledahl Ln
- 5955 Pinkstaff Ln
- 5995 Pinkstaff Ln
- 5885 Tangledahl Ln
Your Personal Tour Guide
Ask me questions while you tour the home.