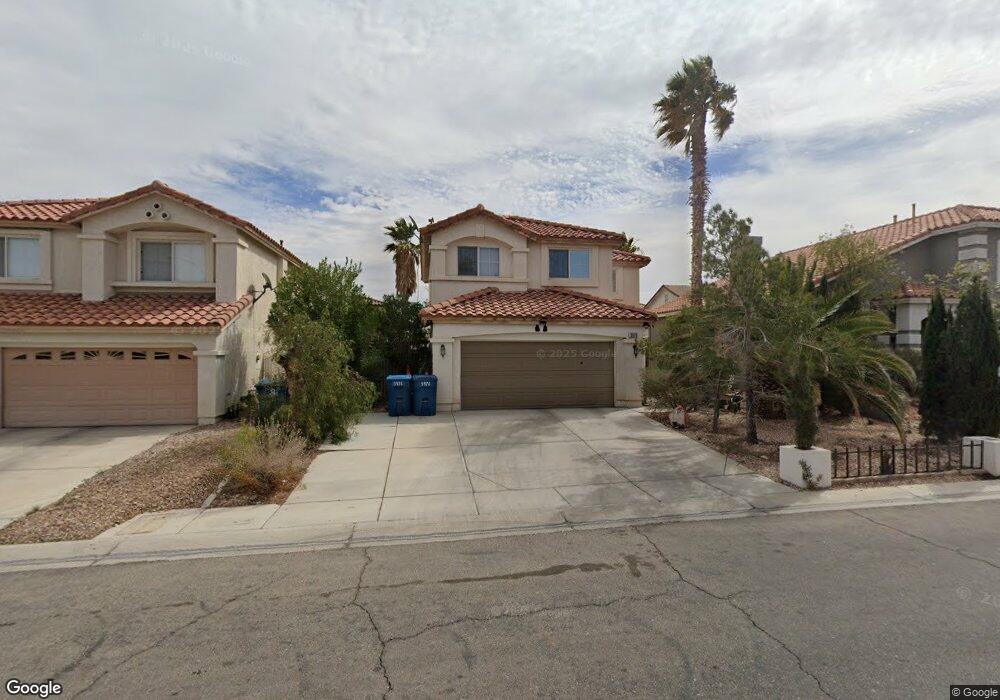
5976 Fly Fisher St Las Vegas, NV 89113
Estimated Value: $433,000 - $445,000
3
Beds
3
Baths
1,553
Sq Ft
$283/Sq Ft
Est. Value
About This Home
This home is located at 5976 Fly Fisher St, Las Vegas, NV 89113 and is currently estimated at $440,251, approximately $283 per square foot. 5976 Fly Fisher St is a home located in Clark County with nearby schools including Lucille S. Rogers Elementary School, Grant Sawyer Middle School, and Durango High School.
Ownership History
Date
Name
Owned For
Owner Type
Purchase Details
Closed on
Dec 13, 2000
Sold by
Adler Jolanta and Szczepanski Edmund
Bought by
Szczepanski Miroslaw and Adler Jolanta
Current Estimated Value
Purchase Details
Closed on
Jan 13, 2000
Sold by
American West Homes Inc
Bought by
Adler Jolanta and Szczepanski Edmund
Purchase Details
Closed on
Nov 12, 1999
Sold by
Szczepanski Miroslaw
Bought by
Adler Jolanta
Home Financials for this Owner
Home Financials are based on the most recent Mortgage that was taken out on this home.
Original Mortgage
$130,100
Interest Rate
8.16%
Purchase Details
Closed on
Nov 10, 1999
Sold by
Szczepanski Klementyna
Bought by
Szczepanski Edmund
Home Financials for this Owner
Home Financials are based on the most recent Mortgage that was taken out on this home.
Original Mortgage
$130,100
Interest Rate
8.16%
Create a Home Valuation Report for This Property
The Home Valuation Report is an in-depth analysis detailing your home's value as well as a comparison with similar homes in the area
Home Values in the Area
Average Home Value in this Area
Purchase History
| Date | Buyer | Sale Price | Title Company |
|---|---|---|---|
| Szczepanski Miroslaw | -- | -- | |
| Adler Jolanta | $136,950 | First American Title Co | |
| Adler Jolanta | -- | First American Title Co | |
| Szczepanski Edmund | -- | First American Title Co |
Source: Public Records
Mortgage History
| Date | Status | Borrower | Loan Amount |
|---|---|---|---|
| Previous Owner | Adler Jolanta | $130,100 |
Source: Public Records
Tax History Compared to Growth
Tax History
| Year | Tax Paid | Tax Assessment Tax Assessment Total Assessment is a certain percentage of the fair market value that is determined by local assessors to be the total taxable value of land and additions on the property. | Land | Improvement |
|---|---|---|---|---|
| 2025 | $1,913 | $104,567 | $45,500 | $59,067 |
| 2024 | $1,772 | $104,567 | $45,500 | $59,067 |
| 2023 | $1,772 | $96,539 | $40,600 | $55,939 |
| 2022 | $1,641 | $80,907 | $29,750 | $51,157 |
| 2021 | $1,520 | $78,107 | $29,400 | $48,707 |
| 2020 | $1,408 | $75,299 | $26,950 | $48,349 |
| 2019 | $1,320 | $70,650 | $23,100 | $47,550 |
| 2018 | $1,259 | $65,571 | $19,950 | $45,621 |
| 2017 | $1,890 | $64,432 | $18,200 | $46,232 |
| 2016 | $1,180 | $59,291 | $14,000 | $45,291 |
| 2015 | $1,177 | $46,057 | $10,500 | $35,557 |
| 2014 | $1,140 | $37,714 | $7,700 | $30,014 |
Source: Public Records
Map
Nearby Homes
- Kaufman Plan at Tenaya Springs
- Avondale Plan at Tenaya Springs
- Lovell Plan at Tenaya Springs
- 5835 Rainbow Trout Ct
- 8162 Seminario Ave
- 6128 Stetson Cove Ct
- 6168 Stetson Cove Ct
- 8555 W Russell Rd Unit 1026
- 6161 Andover Wood Rd
- 5766 Whimsical St
- 5762 Whimsical St
- 5758 Whimsical St
- 5754 Whimsical St
- 5750 Whimsical St
- 5746 Whimsical St
- 5742 Whimsical St
- Barclay Plan at Majestic Point South
- Bedford Plan at Majestic Point South
- Griffin Plan at Majestic Point South
- 6256 Haiku Stairs St
- 5968 Fly Fisher St
- 5984 Fly Fisher St
- 8389 Baden Westwood Ln
- 5960 Fly Fisher St
- 5960 Fly Fisher St Unit na
- 5992 Fly Fisher St
- 8398 Feather Duster Ct
- 8405 Tackle Box Ct
- 8383 Baden Westwood Ln
- 8392 Feather Duster Ct
- 5952 Fly Fisher St
- 6000 Fly Fisher St
- 8404 Chinook Candy Ct
- 8377 Baden Westwood Ln
- 8415 Tackle Box Ct
- 8384 Feather Duster Ct
- 8384 Feather Duster Ct Unit na
- 5944 Fly Fisher St
- 5944 Fly Fisher St Unit n/a
- 6008 Fly Fisher St